DP-203 Study Guide

Design and implement data storage (15–20%)
Implement a partition strategy
Implementing a Partition Strategy for Files
When working with large datasets, particularly in a data lake environment, it’s essential to organize data efficiently to optimize query performance and manageability. Partitioning is a strategy that involves dividing a dataset into multiple parts based on certain criteria, such as date or region. This approach can significantly improve query performance by reducing the amount of data that needs to be read and processed.
Understanding Partitioning
Partitioning data means splitting it across multiple files in subfolders that reflect partitioning criteria. This allows distributed processing systems to work in parallel on different partitions or to skip unnecessary data reads based on filtering criteria https://learn.microsoft.com/en-us/training/modules/query-data-lake-using-azure-synapse-serverless-sql-pools/3-query-files .
How to Implement Partitioning
Choose Partitioning Columns: Identify the columns that are frequently used as filters in queries. Common examples include date fields like year, month, or day, or categorical fields like region or product category.
Create Partitions: When saving a dataframe, use the
partitionBymethod to specify the partitioning columns. This will create a folder hierarchy where each partition is stored in a subfolder named after the partitioning column and value, in acolumn=valueformat https://learn.microsoft.com/en-us/training/modules/transform-data-spark-azure-synapse-analytics/3-partition-data .Example code snippet for partitioning by year:
from pyspark.sql.functions import year, col

# Load source data
df = spark.read.csv('/orders/*.csv', header=True, inferSchema=True)

# Add Year column
dated_df = df.withColumn("Year", year(col("OrderDate")))

# Partition by year
dated_df.write.partitionBy("Year").mode("overwrite").parquet("/data")
Querying Partitioned Data: When querying partitioned data, you can use the folder structure to filter the data efficiently. For instance, if you only need data from a specific year, you can directly read from the corresponding year’s partition .
Example code snippet for reading partitioned data:
orders_2020 = spark.read.parquet('/partitioned_data/Year=2020')
display(orders_2020.limit(5))
Performance Considerations: Partitioning can lead to performance gains, especially when filtering data in queries, as it eliminates unnecessary disk I/O. However, it’s important to avoid creating too many small partitions, as this can lead to increased overhead and reduced performance https://learn.microsoft.com/en-us/training/modules/transform-data-spark-azure-synapse-analytics/3-partition-data .
Additional Resources
For more detailed guidance on implementing a partition strategy, consider exploring the following resources:
- Transform data with Apache Spark in Azure Synapse Analytics
- Load data into a relational data warehouse
By following these steps and best practices, you can implement an effective partition strategy that enhances the performance and scalability of your data processing workflows.
Design and implement data storage (15–20%)
Implement a partition strategy
Implementing a partition strategy for analytical workloads is a critical aspect of optimizing data storage and retrieval for efficient analysis. Partitioning involves dividing a large dataset into smaller, more manageable pieces based on certain criteria, such as date or region. This approach can significantly improve query performance and help manage data at scale.
Partitioning Data in Azure
When working with data in Azure, particularly with Azure Synapse Analytics or Azure Data Lake Storage, partitioning can be implemented to enhance analytical workloads. Here’s how you can approach this:
Identify Partitioning Columns: Choose the columns that will be used to partition the data. Common partitioning strategies involve using time-based columns (e.g., year, month, day) or other categorical columns that can logically divide the data (e.g., region, product category).
Use the
partitionByMethod: In Azure, when saving a DataFrame, you can use thepartitionBymethod to specify the partitioning columns. This method will create a directory structure that reflects the partitioning scheme, with folder names including the column name and value in acolumn=valueformat https://learn.microsoft.com/en-us/training/modules/transform-data-spark-azure-synapse-analytics/3-partition-data .from pyspark.sql.functions import year, col # Load source data df = spark.read.csv('/orders/*.csv', header=True, inferSchema=True) # Add Year column dated_df = df.withColumn("Year", year(col("OrderDate"))) # Partition by year dated_df.write.partitionBy("Year").mode("overwrite").parquet("/data")Hierarchical Partitioning: For more granular control, you can partition the data by multiple columns, creating a hierarchy of folders for each partitioning key. For example, partitioning by year and then by month would result in a folder for each year, containing subfolders for each month https://learn.microsoft.com/en-us/training/modules/transform-data-spark-azure-synapse-analytics/3-partition-data .
Considerations for Azure Synapse Analytics: Azure Synapse Link for SQL provides a hybrid transactional/analytical processing (HTAP) capability that synchronizes transactional data with a dedicated SQL pool for near real-time analytics. This can be leveraged to partition operational data for analytical workloads with minimal impact on transactional performance https://learn.microsoft.com/en-us/training/modules/implement-synapse-link-for-sql/1-introduction .
Managing ETL Workloads: Azure Synapse Analytics pipelines can be used to automate the ETL process, which includes extracting data from various sources, transforming it into a suitable format, and loading it into the analytical store. Pipelines can be configured to handle partitioned data effectively https://learn.microsoft.com/en-us/training/modules/build-data-pipeline-azure-synapse-analytics/1-introduction .
For additional information on partitioning strategies and their implementation in Azure, you can refer to the following resources:
- Transform data with Spark in Azure Synapse Analytics
- Azure Synapse Link for SQL
- Introduction to Azure Data Lake Storage Gen2
- Azure Synapse Analytics pipelines
By following these steps and utilizing the provided resources, you can effectively implement a partition strategy for your analytical workloads in Azure, leading to more efficient data processing and analysis.
Design and implement data storage (15–20%)
Implement a partition strategy
Implementing a partition strategy for streaming workloads is a critical aspect of managing and optimizing the processing of large volumes of real-time data. Partitioning helps distribute the data across multiple storage units or nodes, which can improve performance and scalability. Here’s a detailed explanation of how to implement a partition strategy for streaming workloads:
Partitioning Data in Streaming Workloads
When dealing with streaming data, it’s essential to organize the incoming data in a way that allows for efficient processing and querying. Partitioning is a technique used to divide the data into smaller, more manageable pieces based on certain criteria, such as time windows or key attributes.
Example: Partitioning with PySpark and Delta Lake
In a PySpark streaming context, you can use Delta Lake to store and process streaming data. Delta Lake supports partitioning, which can be particularly useful for append-only streaming workloads. Here’s an example of how to create a stream that reads from a Delta Lake table and how to handle partitioning:
from pyspark.sql.types import *
from pyspark.sql.functions import *
# Load a streaming dataframe from the Delta Table
stream_df = spark.readStream.format("delta") \
.option("ignoreChanges", "true") \
.load("/delta/internetorders")
# Process the streaming data in the dataframe
# For example, show it:
stream_df.writeStream \
.outputMode("append") \
.format("console") \
.start()Note: When using Delta Lake as a streaming source,
you can only include append operations in the stream. To avoid errors
from data modifications, you must specify the ignoreChanges
option https://learn.microsoft.com/en-us/training/modules/use-delta-lake-azure-synapse-analytics/5-use-delta-lake-streaming-data
.
Partitioning by Derived Fields
You can also partition data by derived fields, such as a date or timestamp, which can be useful for organizing streaming data into temporal segments. Here’s an example using PySpark to partition data by year:
from pyspark.sql.functions import year, col

# Load source data
df = spark.read.csv('/orders/*.csv', header=True, inferSchema=True)

# Add Year column
dated_df = df.withColumn("Year", year(col("OrderDate")))

# Partition by year
dated_df.write.partitionBy("Year").mode("overwrite").parquet("/data")The resulting folder structure will include the partitioning column
name and value in a column=value format, facilitating
efficient data access and query performance https://learn.microsoft.com/en-us/training/modules/transform-data-spark-azure-synapse-analytics/3-partition-data
.
Additional Resources
For more information on partitioning strategies and best practices, you can refer to the following resources:
- Transform data with Apache Spark in Azure Synapse Analytics https://learn.microsoft.com/en-us/training/modules/transform-data-spark-azure-synapse-analytics/3-partition-data .
- Stream data as input into Stream Analytics for understanding different input sources for streaming data https://learn.microsoft.com/en-us/training/modules/visualize-real-time-data-azure-stream-analytics-power-bi/2-power-bi-output .
By implementing a partition strategy for streaming workloads, you can ensure that your data processing is optimized for performance and scalability, enabling real-time analytics and decision-making.
Design and implement data storage (15–20%)
Implement a partition strategy
Implementing a partition strategy for Azure Synapse Analytics is a crucial aspect of optimizing data storage and access performance. Partitioning allows you to divide your data into smaller, more manageable pieces, which can improve query performance and data organization. Here’s a detailed explanation of how to implement a partition strategy:
Partitioning Data in Azure Synapse Analytics
When working with large datasets in Azure Synapse Analytics, it’s beneficial to partition your data. Partitioning can help manage and query large tables by breaking them down into smaller, more manageable pieces called partitions. Each partition can be accessed and managed independently, which can lead to more efficient data processing.
Using the partitionBy
Method
To save a dataframe as a partitioned set of files in Azure Synapse
Analytics, you can use the partitionBy method when writing
the data. This method allows you to specify one or more columns to use
as partition keys. Data is then organized into folders based on the
unique values in the partition column(s).
Here’s an example of how to partition data by year:
from pyspark.sql.functions import year, col

# Load source data
df = spark.read.csv('/orders/*.csv', header=True, inferSchema=True)

# Add Year column
dated_df = df.withColumn("Year", year(col("OrderDate")))

# Partition by year
dated_df.write.partitionBy("Year").mode("overwrite").parquet("/data")In this example, the OrderDate column is used to create
a derived Year field, which is then used to partition the
data. The resulting folder names include the partitioning column name
and value in a column=value format.
Partitioning by Multiple Columns
You can also partition the data by multiple columns, which results in a hierarchy of folders for each partitioning key. For instance, you could partition the data by both year and month, creating a folder for each year that contains subfolders for each month.
Benefits of Partitioning
- Improved Query Performance: Queries that filter data based on the partition key can run faster because they only need to process data in relevant partitions.
- Cost Efficiency: By partitioning data, you can reduce the amount of data that needs to be scanned during queries, which can lead to cost savings.
- Data Management: Partitioning makes it easier to manage and maintain data, especially when dealing with large volumes.
Considerations
- Partition Strategy: Choose a partition key that is commonly used in query predicates to maximize performance benefits.
- Partition Granularity: Be mindful of the granularity of partitions. Too many small partitions can lead to increased metadata overhead and may degrade performance.
For additional information on partitioning data in Azure Synapse Analytics, you can refer to the following resources:
- Transform data with Apache Spark in Azure Synapse Analytics https://learn.microsoft.com/en-us/training/modules/transform-data-spark-azure-synapse-analytics/3-partition-data .
- Azure Synapse Analytics documentation https://learn.microsoft.com/en-us/training/modules/build-data-pipeline-azure-synapse-analytics/1-introduction .
By implementing a thoughtful partition strategy, you can optimize your Azure Synapse Analytics environment for better performance and efficiency.
Design and implement data storage (15–20%)
Implement a partition strategy
Identifying When Partitioning is Needed in Azure Data Lake Storage Gen2
Partitioning in Azure Data Lake Storage Gen2 is a critical aspect to consider when designing a data storage strategy for big data analytics. It is essential for optimizing the performance and manageability of large datasets. Here are some scenarios where partitioning is particularly beneficial:
Performance Optimization: Partitioning can significantly improve query performance. When data is partitioned, it is organized into subsets that can be processed in parallel, reducing the amount of data that needs to be read and processed for a particular query.
Cost Efficiency: By partitioning data, you can reduce the cost of data operations. Since compute costs are associated with the amount of data processed, partitioning allows you to process only the relevant partitions rather than the entire dataset.
Data Management: Partitioning aids in the management of data lifecycle. For instance, you can set up different storage tiers or retention policies for different partitions, making it easier to archive or delete old data.
Scalability: As datasets grow, partitioning ensures that the system can scale to handle the increased load. It allows for the distribution of data across multiple nodes, preventing bottlenecks and ensuring consistent performance.
Concurrent Access: When multiple users or applications need to access the data lake simultaneously, partitioning can help prevent contention by logically separating the data into different partitions.
For more information on partitioning and how to implement it in Azure Data Lake Storage Gen2, you can refer to the following resources:
- Introduction to Azure Data Lake Storage Gen2
- Create a storage account to use with Azure Data Lake Storage Gen2
Partitioning is a key consideration when working with Azure Data Lake Storage Gen2, and understanding when and how to apply it is crucial for building efficient and scalable big data analytics solutions.
Remember, when setting up partitioning in Azure Data Lake Storage Gen2, it’s important to consider the specific requirements of your workload and the characteristics of your data to determine the most effective partitioning strategy.
Design and implement data storage (15–20%)
Design and implement the data exploration layer
Create and Execute Queries Using SQL Serverless and Spark Cluster
When working with Azure Synapse Analytics, you have the option to utilize both SQL serverless and Spark clusters to create and execute queries on your data. Here’s a detailed explanation of how to leverage these two compute solutions:
SQL Serverless in Azure Synapse Analytics
SQL serverless is a query service that allows you to analyze data in your data lake without the need to provision or manage any resources. It provides a pay-per-query model, meaning you are only charged for the amount of data processed by your queries.
Key Features: - Query Data In-Place: You can use familiar Transact-SQL syntax to query data directly within your data lake, without needing to copy or load the data into a specialized store https://learn.microsoft.com/en-us/training/modules/query-data-lake-using-azure-synapse-serverless-sql-pools/2-understand-serverless-pools . - Connectivity: It offers integrated connectivity with a range of business intelligence and querying tools https://learn.microsoft.com/en-us/training/modules/query-data-lake-using-azure-synapse-serverless-sql-pools/2-understand-serverless-pools . - Performance: The service is designed for large-scale data and includes distributed query processing, which results in fast query performance https://learn.microsoft.com/en-us/training/modules/query-data-lake-using-azure-synapse-serverless-sql-pools/2-understand-serverless-pools . - Reliability: Built-in query execution fault-tolerance ensures high success rates for long-running queries involving large datasets https://learn.microsoft.com/en-us/training/modules/query-data-lake-using-azure-synapse-serverless-sql-pools/2-understand-serverless-pools . - Ease of Use: There is no infrastructure to set up or clusters to maintain, and you can start querying data as soon as your Azure Synapse workspace is created https://learn.microsoft.com/en-us/training/modules/query-data-lake-using-azure-synapse-serverless-sql-pools/2-understand-serverless-pools .
Example Query:
-- Use the default database or specify your database
USE default;
-- Query a Delta Lake table
SELECT * FROM MyDeltaTable;This example demonstrates how to query a catalog table containing Delta Lake data using serverless SQL pool https://learn.microsoft.com/en-us/training/modules/use-delta-lake-azure-synapse-analytics/6-delta-with-sql .
For more information on querying Delta Lake files using serverless SQL pool, you can refer to the Azure Synapse Analytics documentation: Query Delta Lake files using serverless SQL pool in Azure Synapse Analytics https://learn.microsoft.com/en-us/training/modules/use-delta-lake-azure-synapse-analytics/6-delta-with-sql .
Spark Clusters in Azure Synapse Analytics
Apache Spark is a distributed data processing framework that enables large-scale data analytics by coordinating work across multiple processing nodes in a cluster https://learn.microsoft.com/en-us/training/modules/understand-big-data-engineering-with-apache-spark-azure-synapse-analytics/2-get-to-know-spark . In Azure Synapse Analytics, Spark clusters can be used to perform complex data processing and analytics tasks.
Key Features: - Data Processing: Spark clusters can handle large volumes of data and complex analytics, making them suitable for big data scenarios https://learn.microsoft.com/en-us/training/modules/understand-big-data-engineering-with-apache-spark-azure-synapse-analytics/2-get-to-know-spark . - Integration: Spark clusters in Azure Synapse Analytics can access data in the Spark metastore and query catalog tables created using Spark SQL https://learn.microsoft.com/en-us/training/modules/use-delta-lake-azure-synapse-analytics/6-delta-with-sql . - Flexibility: Spark provides the ability to overlay a relational schema on underlying data lake files, which can then be queried using SQL https://learn.microsoft.com/en-us/training/modules/create-metadata-objects-azure-synapse-serverless-sql-pools/7-knowledge-check .
Example Usage: To execute queries using a Spark cluster, you would typically write Spark SQL code or use Spark DataFrame APIs to process and analyze data stored in various file formats like CSV, JSON, and Parquet.
For more information on the capabilities and use cases for serverless SQL pools and Spark clusters in Azure Synapse Analytics, you can explore the following resource: Azure Synapse Analytics documentation https://learn.microsoft.com/en-us/training/modules/query-data-lake-using-azure-synapse-serverless-sql-pools/1-introduction .
By combining the power of SQL serverless and Spark clusters, you can efficiently process and analyze data in Azure Synapse Analytics, leveraging the strengths of both compute solutions to gain insights from your data.
Design and implement data storage (15–20%)
Design and implement the data exploration layer
Azure Synapse Analytics Database Templates
Azure Synapse Analytics offers a variety of database templates that serve as a starting point for creating lake databases tailored to specific business scenarios. These templates reflect common schemas found across various industries, enabling users to quickly establish a structured relational schema that is decoupled from the underlying file-based storage in a data lake https://learn.microsoft.com/en-us/training/modules/create-metadata-objects-azure-synapse-serverless-sql-pools/3-database-templates .
Benefits of Using Database Templates
- Predefined Schemas: Templates come with predefined schemas suitable for different business domains such as agriculture, automotive, banking, healthcare, and more, which can accelerate the development process https://learn.microsoft.com/en-us/training/modules/create-metadata-objects-azure-synapse-serverless-sql-pools/3-database-templates .
- Flexibility: Users can either use these templates as they are or modify them according to their needs, adding or altering tables and relationships as required https://learn.microsoft.com/en-us/training/modules/create-metadata-objects-azure-synapse-serverless-sql-pools/3-database-templates .
- Combination of Data Lake and Relational Database: Lake databases in Azure Synapse Analytics allow users to enjoy the benefits of a relational schema while retaining the flexibility of a data lake https://learn.microsoft.com/en-us/training/modules/create-metadata-objects-azure-synapse-serverless-sql-pools/1-introduction .
How to Implement Database Templates
- Select a Template: Choose an appropriate template from the collection provided by Azure Synapse Analytics that best fits the business scenario https://learn.microsoft.com/en-us/training/modules/create-metadata-objects-azure-synapse-serverless-sql-pools/3-database-templates .
- Create a Lake Database: Use the selected template as a foundation to create a lake database. This can be done from an empty schema or by modifying the template https://learn.microsoft.com/en-us/training/modules/create-metadata-objects-azure-synapse-serverless-sql-pools/3-database-templates .
- Customize the Schema: Add definitions for tables and the relationships between them as needed. The schema can be tailored to meet the specific requirements of the project https://learn.microsoft.com/en-us/training/modules/create-metadata-objects-azure-synapse-serverless-sql-pools/3-database-templates .
Additional Resources
For more information on lake databases and how to utilize Azure Synapse Analytics database templates, refer to the following resources:
- Azure Synapse Analytics Documentation: Lake Database Concepts and Components https://learn.microsoft.com/en-us/training/modules/create-metadata-objects-azure-synapse-serverless-sql-pools/8-summary .
- Azure Synapse Analytics Learning Module: This module provides insights on understanding lake database concepts, describing database templates, and creating a lake database https://learn.microsoft.com/en-us/training/modules/create-metadata-objects-azure-synapse-serverless-sql-pools/8-summary .
By leveraging Azure Synapse Analytics database templates, data analysts and engineers can efficiently create lake databases that combine the scalability and flexibility of data lakes with the structured querying capabilities of relational databases. This approach simplifies data management and accelerates the delivery of data solutions in the cloud.
Design and implement data storage (15–20%)
Design and implement the data exploration layer
Pushing New or Updated Data Lineage to Microsoft Purview
Data lineage is a critical aspect of data management, providing visibility into the lifecycle of data as it moves and transforms across various stages. In Microsoft Purview, data lineage is represented visually, illustrating the movement of data from its source to its destination https://learn.microsoft.com/en-us/training/modules/intro-to-microsoft-purview/3-how-microsoft-purview-works .
To push new or updated data lineage information to Microsoft Purview, follow these steps:
Data Lifecycle Management: Understand the lifecycle of your data, including sourcing, movement, storage, and any transformations it undergoes during ELT/ETL operations https://learn.microsoft.com/en-us/training/modules/intro-to-microsoft-purview/3-how-microsoft-purview-works .
Visual Representation: Microsoft Purview displays data lineage visually, which can be used to trace the root cause of data issues, perform data quality analysis, and ensure compliance https://learn.microsoft.com/en-us/training/modules/intro-to-microsoft-purview/3-how-microsoft-purview-works .
Pipeline Publishing and Monitoring: Publish your data pipeline in Azure Synapse Studio and set up triggers to run it. These triggers can be immediate, scheduled, or event-based. Monitor the pipeline runs on the Monitor page in Azure Synapse Studio for troubleshooting and tracking data lineage flows https://learn.microsoft.com/en-us/training/modules/build-data-pipeline-azure-synapse-analytics/5-run-pipelines .
Integration with Azure Synapse Analytics: Utilize the integration between Azure Synapse Analytics and Microsoft Purview to enhance the tracking of data lineage. This integration allows for a more comprehensive view of data flows and lineage https://learn.microsoft.com/en-us/training/modules/build-data-pipeline-azure-synapse-analytics/5-run-pipelines .
Search and Discovery in Microsoft Purview: Use the Microsoft Purview Data Catalog to search for information using text-based searches, filters, and business context. Define business glossaries, import existing ones, and apply business contexts to assets in the data map to facilitate easier discovery and understanding of data lineage https://learn.microsoft.com/en-us/training/modules/intro-to-microsoft-purview/3-how-microsoft-purview-works .
Data Map Utilization: The data map in Microsoft Purview is foundational, consisting of data assets, lineage, classifications, and business context. It serves as a knowledge graph, making it easier to register, scan, and classify data at scale. Use collections within the data map to organize and manage access to metadata https://learn.microsoft.com/en-us/training/modules/intro-to-microsoft-purview/3-how-microsoft-purview-works .
Updating Data Lineage: When new data sources are registered or existing ones are updated, ensure that the data map is refreshed to reflect these changes. This will keep the data lineage current and accurate https://learn.microsoft.com/en-us/training/modules/intro-to-microsoft-purview/2-what-is-microsoft-purview https://learn.microsoft.com/en-us/training/modules/intro-to-microsoft-purview/3-how-microsoft-purview-works .
For additional information on integrating Microsoft Purview and Azure Synapse Analytics, you can refer to the following URL: Integrate Microsoft Purview and Azure Synapse Analytics https://learn.microsoft.com/en-us/training/modules/build-data-pipeline-azure-synapse-analytics/5-run-pipelines .
By following these steps, you can effectively manage and push new or updated data lineage to Microsoft Purview, ensuring that your data governance remains robust and your data assets are well-understood and compliant.
Design and implement data storage (15–20%)
Design and implement the data exploration layer
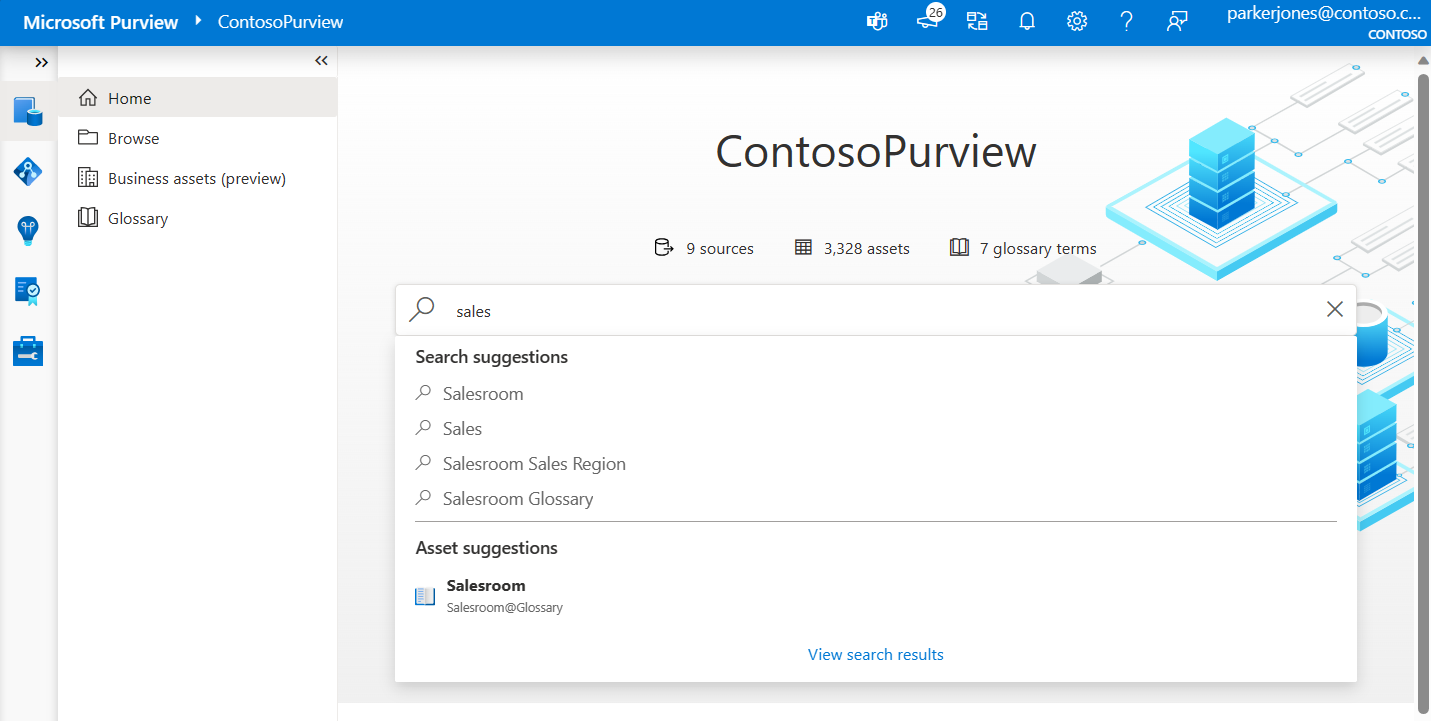
Browse and Search Metadata in Microsoft Purview Data Catalog
Microsoft Purview Data Catalog offers a robust solution for managing and understanding metadata across your data estate. It is designed to facilitate the discovery and governance of data assets within an organization. Here’s a detailed explanation of how to browse and search metadata using the Microsoft Purview Data Catalog:
Browsing Metadata
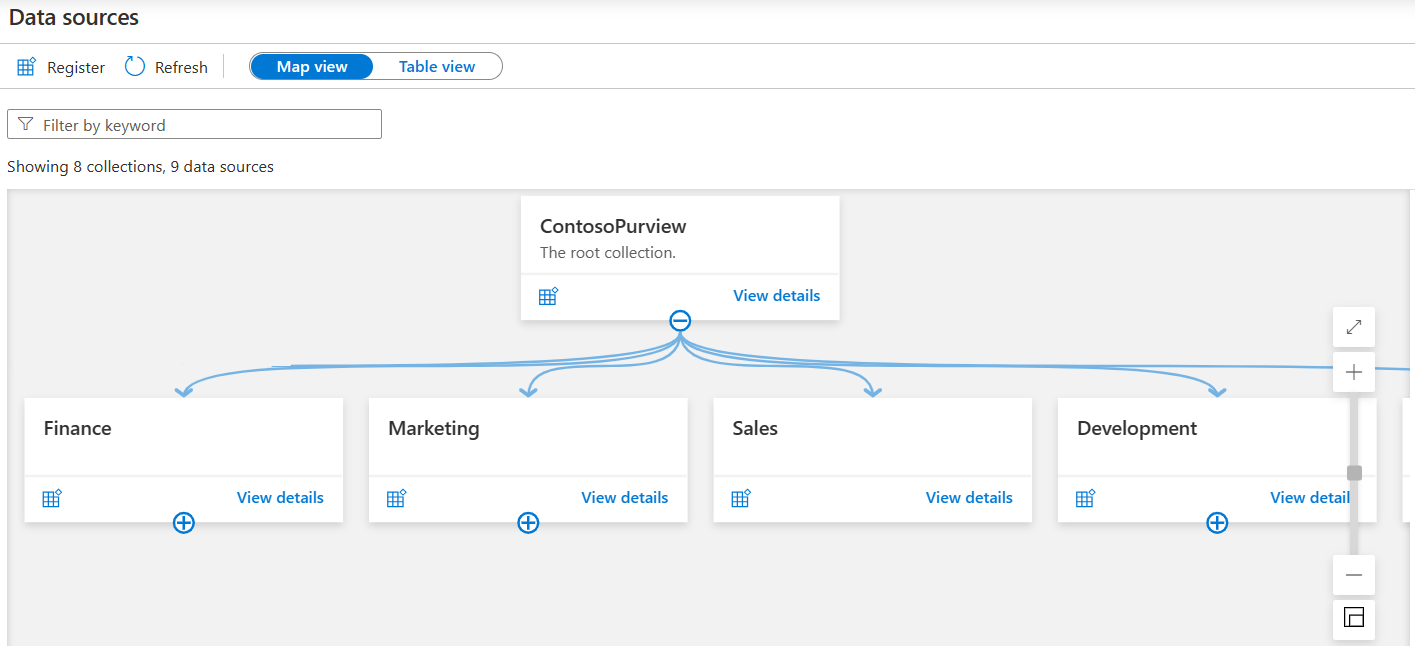
- Unified Data Map: The Microsoft Purview Data Map acts as a comprehensive map of your data assets, allowing you to visualize and govern your data estate effectively https://learn.microsoft.com/en-us/training/modules/intro-to-microsoft-purview/3-how-microsoft-purview-works .
- Collections: Collections in the data map help organize data assets into logical categories, simplifying the management and discovery of assets within the catalog https://learn.microsoft.com/en-us/training/modules/intro-to-microsoft-purview/3-how-microsoft-purview-works .
- Map View: The Map view in the Microsoft Purview governance portal displays data sources graphically, along with the collections created for them, making it easier to browse through the metadata https://learn.microsoft.com/en-us/training/modules/intro-to-microsoft-purview/3-how-microsoft-purview-works .
Searching Metadata
- Text-Based Search: Users can perform text-based searches within the Microsoft Purview Data Catalog to find specific data assets based on their metadata https://learn.microsoft.com/en-us/training/modules/intro-to-microsoft-purview/3-how-microsoft-purview-works .
- Filters: Search results can be refined using filters such as data source type, tags, ratings, or collection, enabling users to narrow down the data assets they are looking for https://learn.microsoft.com/en-us/training/modules/intro-to-microsoft-purview/3-how-microsoft-purview-works .
- Semantic Search and Browse: Semantic search capabilities allow users to find data assets that are semantically related to their search terms, enhancing the relevance of search results https://learn.microsoft.com/en-us/training/modules/intro-to-microsoft-purview/3-how-microsoft-purview-works .
- Business Glossary: Users can define and import business glossaries, which can then be used to search and apply business context to data assets in the data map https://learn.microsoft.com/en-us/training/modules/intro-to-microsoft-purview/3-how-microsoft-purview-works .
- Data Lineage: The catalog provides information on data lineage, including sources, owners, transformations, and lifecycle, which can be used to understand the metadata contextually https://learn.microsoft.com/en-us/training/modules/intro-to-microsoft-purview/3-how-microsoft-purview-works .
Additional Features
- Metadata Indexing: Once data sources are registered and scanned, the metadata is indexed to make each data source easily discoverable via search https://learn.microsoft.com/en-us/training/modules/intro-to-microsoft-purview/4-when-to-use-microsoft-purview .
- User Contributions: Users can enhance the catalog by tagging, documenting, and annotating data sources, thereby enriching the metadata and aiding in the discovery process https://learn.microsoft.com/en-us/training/modules/intro-to-microsoft-purview/4-when-to-use-microsoft-purview .
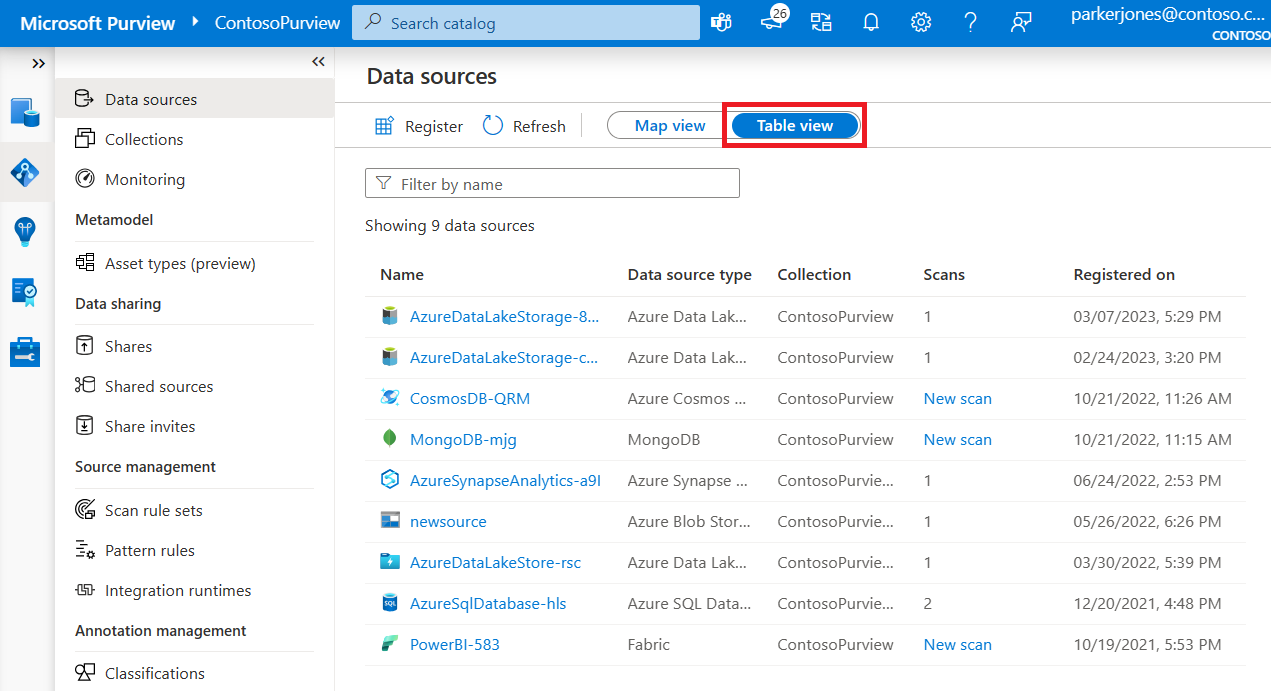
For more information on how to utilize the Microsoft Purview Data Catalog for browsing and searching metadata, you can refer to the following resources: - Introduction to Microsoft Purview - Search information from the data map - Data map collections - List view of data sources
These resources provide visual aids and further details on how to navigate and make the most of the Microsoft Purview Data Catalog’s capabilities.
Develop data processing (40–45%)
Ingest and transform data
Design and Implement Incremental Loads
Incremental loads are a crucial aspect of data warehousing, where only the changes since the last load are transferred to the data warehouse. This approach is efficient and minimizes the volume of data that needs to be processed during each load operation. Here’s a detailed explanation of how to design and implement incremental loads:
Identify Changes: Determine the new or updated data in the source systems since the last load. This can be achieved by using timestamps, version numbers, or change data capture (CDC) mechanisms.
Extract Changes: Once the changes are identified, extract this data from the source systems. This step may involve using an ETL (Extract, Transform, Load) tool or writing custom scripts to pull the changed data.
Stage Changes: Load the extracted data into staging tables. Staging tables are temporary and used to hold data before it’s loaded into the data warehouse. This allows for any necessary transformations or cleansing to be performed on the data https://learn.microsoft.com/en-us/training/modules/design-multidimensional-schema-to-optimize-analytical-workloads/4-load-data .
Transform Data: Apply any required transformations to the staged data. This could include cleansing, deduplication, or reformatting the data to match the data warehouse schema.
Load Incremental Data: Load the transformed data into the data warehouse. This typically involves using SQL statements such as
INSERT,UPDATE, orMERGEto add or update the data in the dimension and fact tables https://learn.microsoft.com/en-us/training/modules/design-multidimensional-schema-to-optimize-analytical-workloads/4-load-data .Optimize Post-Load: After loading the data, perform optimization tasks such as updating indexes and refreshing table distribution statistics to ensure that the data warehouse performs efficiently https://learn.microsoft.com/en-us/training/modules/design-multidimensional-schema-to-optimize-analytical-workloads/4-load-data .
Automation: Automate the incremental load process to run at regular intervals, ensuring that the data warehouse is kept up-to-date with minimal manual intervention.
Monitoring and Logging: Implement monitoring and logging to track the success or failure of the incremental loads. This helps in troubleshooting any issues that may arise during the process.
For additional information on implementing incremental loads and other data warehousing tasks, you can refer to the following resources:
- Load data into a relational data warehouse https://learn.microsoft.com/en-us/training/modules/design-multidimensional-schema-to-optimize-analytical-workloads/4-load-data .
- Data Flow activity in Azure Data Factory and Azure Synapse Analytics https://learn.microsoft.com/en-us/training/modules/build-data-pipeline-azure-synapse-analytics/4-define-data-flows .
By following these steps and utilizing the provided resources, you can effectively design and implement incremental loads to ensure that your data warehouse remains current and efficient.
Develop data processing (40–45%)
Ingest and transform data
Transforming Data Using Apache Spark
Apache Spark is a powerful platform for large-scale data processing. It provides a comprehensive ecosystem for data cleansing, transformation, and analysis. When working with Apache Spark, the primary structure for handling data is the dataframe object. Dataframes allow you to query and manipulate data efficiently, making them ideal for transforming data within a data lake environment.
Loading Data into Dataframes
To begin transforming data with Apache Spark, you first need to load
your data into a dataframe. This is done using the
spark.read function, where you specify the file format and
path, and optionally, the schema of the data. Here’s an example of how
to load data from CSV files into a dataframe:
order_details = spark.read.csv('/orders/*.csv', header=True, inferSchema=True)
display(order_details.limit(5))Data Transformation Tasks
Once the data is loaded into a dataframe, you can perform a variety of transformation tasks. These tasks can include filtering rows, selecting specific columns, joining data from multiple sources, aggregating data, and more. Apache Spark’s API provides a rich set of functions for these operations, which can be applied to the dataframes.
Saving Transformed Data
After transforming the data, you can persist the results back into the data lake or export them for further processing or analysis. Apache Spark allows you to save the transformed data in various file formats, ensuring compatibility with downstream systems and processes.
Apache Spark Pools in Azure Synapse Analytics
Azure Synapse Analytics integrates Apache Spark pools, enabling you to run Spark workloads as part of your data ingestion and preparation workflows. You can use the natively supported notebooks within Azure Synapse Analytics to write and execute code on a Spark pool, preparing your data for analysis. Subsequently, you can utilize other capabilities of Azure Synapse Analytics, such as SQL pools, to work with the transformed data.
df = spark.read.load('abfss://data@datalake.dfs.core.windows.net/sensors/*', format='parquet')
display(df)https://learn.microsoft.com/en-us/training/modules/ingest-streaming-data-use-azure-stream-analytics-synapse/5-run-job-ingest https://learn.microsoft.com/en-us/training/modules/transform-data-spark-azure-synapse-analytics/1-introduction
Integrated Notebook Interface
Azure Synapse Studio includes an integrated notebook interface for working with Spark, similar to Jupyter notebooks. Notebooks are an intuitive way to combine code with Markdown notes and are commonly used by data scientists and data analysts. They can be run interactively or included in automated pipelines for unattended execution.
Notebooks consist of cells that can contain either code or Markdown. Features such as syntax highlighting, error support, code auto-completion, and interactive data visualizations enhance productivity and ease of use.
Additional Resources
For more information on using Apache Spark within Azure Synapse Analytics, you can refer to the following resources:
- To learn about querying files in a data lake using serverless SQL pools and Apache Spark pools, visit the Use Azure Synapse serverless SQL pool to query files in a data lake and Analyze data with Apache Spark in Azure Synapse Analytics modules on Microsoft Learn.
- For guidance on working with notebooks in Azure Synapse Analytics, see the Create, develop, and maintain Synapse notebooks in Azure Synapse Analytics article.
By leveraging Apache Spark within Azure Synapse Analytics, you can perform robust data transformation tasks, facilitating the preparation of data for insightful analysis and business intelligence.
Develop data processing (40–45%)
Ingest and transform data
Transform Data Using Transact-SQL (T-SQL) in Azure Synapse Analytics
Transact-SQL (T-SQL) is the primary means for data transformation within Azure Synapse Analytics. It is an extension of SQL that is used in Microsoft SQL Server and Azure SQL Database. T-SQL provides a rich set of commands that can be used to perform complex data transformations and manipulations.
Ingesting Streaming Data
To ingest streaming data into Azure Synapse Analytics, a simple
approach is to use a SELECT...INTO query. This query
captures the required field values for every event and writes them into
a table in a dedicated SQL pool. The schema of the results produced by
the query must match the schema of the target table. Fields can be
renamed and cast to compatible data types as necessary using
AS clauses https://learn.microsoft.com/en-us/training/modules/ingest-streaming-data-use-azure-stream-analytics-synapse/4-define-query
.
Example Query:
SELECT EventEnqueuedUtcTime AS ReadingTime, SensorID, ReadingValue
INTO [synapse-output]
FROM [streaming-input]
TIMESTAMP BY EventEnqueuedUtcTimeWorking with Hybrid Transactional/Analytical Processing (HTAP)
Azure Synapse Analytics offers HTAP capabilities through Azure Synapse Link for Cosmos DB. This feature allows operational data in Azure Cosmos DB to be made available for analysis in Azure Synapse Analytics in near-real time. This integration eliminates the need for a complex ETL pipeline, simplifying the process of analyzing operational data https://learn.microsoft.com/en-us/training/modules/configure-azure-synapse-link-with-azure-cosmos-db/1-introduction .
Analyzing Data with T-SQL
T-SQL can be used to analyze data within Azure Synapse Analytics. It supports querying data from various sources, including data lakes, SQL pools, and external databases. Azure Synapse Link for SQL enables the synchronization of changes made to tables in source databases like Azure SQL Database and Microsoft SQL Server 2022 to a dedicated SQL pool in Azure Synapse Analytics for analysis https://learn.microsoft.com/en-us/training/modules/implement-synapse-link-for-sql/2-understand-synapse-link-sql https://learn.microsoft.com/en-us/training/modules/design-hybrid-transactional-analytical-processing-using-azure-synapse-analytics/3-describe-supported-analytical-workloads .
Key Points for Data Transformation with T-SQL:
- T-SQL is used for complex data transformations within Azure Synapse Analytics.
- Streaming data can be ingested using
SELECT...INTOqueries. - Schema matching is essential when writing results to a table.
- HTAP integration is facilitated by Azure Synapse Link for Cosmos DB and Azure Synapse Link for SQL.
- Data from various sources can be analyzed using T-SQL in Azure Synapse Analytics.
For additional information on using T-SQL in Azure Synapse Analytics, you can refer to the following resources:
- Ingesting streaming data into Azure Synapse Analytics
- Azure Synapse Link for Cosmos DB
- Azure Synapse Link for SQL
Please note that the URLs provided are for reference purposes and are part of the study material.
Develop data processing (40–45%)
Ingest and transform data
Ingesting and Transforming Data with Azure Synapse Pipelines and Azure Data Factory
Azure Synapse Analytics and Azure Data Factory provide robust data integration services that enable the implementation of complex Extract, Transform, and Load (ETL) solutions, which are essential for supporting enterprise-level data analytics.
Azure Synapse Pipelines
Pipelines in Azure Synapse Analytics are the primary mechanism for defining and orchestrating data movement activities. They allow you to create ETL workflows that can automate the process of data ingestion, transformation, and loading. These pipelines are composed of interconnected activities that can move data from various sources, process it using transformations, and load it into a target data store for analytics.
Creating Pipelines: You can develop and debug pipelines using Azure Synapse Studio, which offers an interactive authoring experience. For more information on developing and debugging pipelines, refer to the following resource: Iterative development and debugging with Azure Data Factory and Synapse Analytics pipelines https://learn.microsoft.com/en-us/training/modules/build-data-pipeline-azure-synapse-analytics/8-summary .
Running Pipelines: Once a pipeline is created, it can be executed either on-demand or on a scheduled basis. This allows for regular automation of ETL workloads as part of a larger enterprise analytical solution.
Azure Data Factory
Azure Data Factory shares the same underlying technology as Azure Synapse Analytics pipelines, providing a similar experience for authoring ETL processes. It is designed to manage and orchestrate the movement of data between different data stores within Azure.
ETL Workloads: Azure Data Factory enables you to automate ETL workloads, which is often a requirement in enterprise analytics solutions. It supports a wide range of data stores and provides a flexible service for managing data movement.
Authoring Experience: The authoring processes in Azure Data Factory are applicable to Azure Synapse Analytics pipelines as well. For a detailed discussion on the differences between the two services, you can visit: Data integration in Azure Synapse Analytics versus Azure Data Factory https://learn.microsoft.com/en-us/training/modules/build-data-pipeline-azure-synapse-analytics/1-introduction .
Ingesting Streaming Data
Azure Synapse Analytics also supports the ingestion of streaming data. The simplest approach is to use a SELECT…INTO query to capture the required field values for every event and write them to a table in a dedicated SQL pool.
Example Query:
SELECT EventEnqueuedUtcTime AS ReadingTime, SensorID, ReadingValue INTO [synapse-output] FROM [streaming-input] TIMESTAMP BY EventEnqueuedUtcTimeThis query captures streaming data and writes it to a specified output, ensuring that the schema of the results matches the target table https://learn.microsoft.com/en-us/training/modules/ingest-streaming-data-use-azure-stream-analytics-synapse/4-define-query .
Working with Ingested Data
Once the data is ingested, it can be combined with other data within Azure Synapse Analytics. This includes data ingested using batch processing techniques or synchronized from operational data sources through Azure Synapse Link https://learn.microsoft.com/en-us/training/modules/ingest-streaming-data-use-azure-stream-analytics-synapse/5-run-job-ingest .
Querying Delta Lake Tables
Azure Synapse Analytics allows querying Delta Lake tables using the serverless SQL pool. Delta Lake tables store their underlying data in Parquet format, which is a common format used in data lake ingestion pipelines https://learn.microsoft.com/en-us/training/modules/use-delta-lake-azure-synapse-analytics/2-understand-delta-lake .
By leveraging Azure Synapse Pipelines and Azure Data Factory, organizations can create comprehensive ETL workflows that are scalable, reliable, and integral to data-driven decision-making processes.
Develop data processing (40–45%)
Ingest and transform data
Transform Data by Using Azure Stream Analytics
Azure Stream Analytics is a powerful service for real-time data processing and analytics. It enables the transformation of streaming data from various sources, such as Azure Event Hubs, Azure IoT Hubs, and Azure Blob or Data Lake Gen 2 Storage https://learn.microsoft.com/en-us/training/modules/visualize-real-time-data-azure-stream-analytics-power-bi/2-power-bi-output https://learn.microsoft.com/en-us/training/modules/ingest-streaming-data-use-azure-stream-analytics-synapse/3-configure-inputs-outputs . Here’s a detailed explanation of how data transformation is achieved using Azure Stream Analytics:
Inputs
The first step in transforming data with Azure Stream Analytics is to define the inputs. Inputs are the sources of streaming data that the service will consume and process. Azure Stream Analytics can ingest data from:
- Azure Event Hubs
- Azure IoT Hubs
- Azure Blob Storage
- Azure Data Lake Storage Gen2
Each input includes not only the data fields from the streamed events
but also metadata fields specific to the input type. For instance, when
consuming data from Azure Event Hubs, an
EventEnqueuedUtcTime field is included, which indicates the
time the event was received https://learn.microsoft.com/en-us/training/modules/visualize-real-time-data-azure-stream-analytics-power-bi/2-power-bi-output
https://learn.microsoft.com/en-us/training/modules/ingest-streaming-data-use-azure-stream-analytics-synapse/3-configure-inputs-outputs
.
Query Processing
Once the input is defined, Azure Stream Analytics uses a query to process the data. The query can perform various operations such as selecting, projecting, and aggregating data values. This is where the transformation of data takes place. The query language used is similar to SQL, making it familiar to many developers and data professionals https://learn.microsoft.com/en-us/training/modules/introduction-to-data-streaming/3-event-processing .
Outputs
After processing the data, Azure Stream Analytics sends the results to an output. Outputs can be various Azure services where the transformed data will be stored or further processed. Common outputs include:
- Azure Data Lake Storage Gen2
- Azure SQL Database
- Azure Synapse Analytics
- Azure Functions
- Azure Event Hubs
- Microsoft Power BI
For example, to ingest data into Azure Synapse Analytics, a simple
SELECT...INTO query can be used to capture the required
field values for every event and write the results to a table in a
dedicated SQL pool https://learn.microsoft.com/en-us/training/modules/ingest-streaming-data-use-azure-stream-analytics-synapse/4-define-query
.
Continuous Processing
Azure Stream Analytics queries run continuously, processing new data as it arrives in the input and storing results in the output. This ensures that data is processed in real-time, providing up-to-date insights https://learn.microsoft.com/en-us/training/modules/introduction-to-data-streaming/3-event-processing .
Reliability and Performance
Azure Stream Analytics guarantees exactly-once event processing and at-least-once event delivery, ensuring that no events are lost. It has built-in recovery capabilities and checkpointing to maintain the state of the job and produce repeatable results. As a fully managed PaaS solution, it offers high reliability and performance due to its in-memory compute capabilities https://learn.microsoft.com/en-us/training/modules/introduction-to-data-streaming/3-event-processing .
Additional Resources
For more information about streaming inputs and how to define them in Azure Stream Analytics, you can refer to the official documentation: Stream data as input into Stream Analytics https://learn.microsoft.com/en-us/training/modules/visualize-real-time-data-azure-stream-analytics-power-bi/2-power-bi-output .
For further details on writing query results to Azure Synapse Analytics and ensuring schema compatibility, please visit: Use Azure Stream Analytics to ingest data into Azure Synapse Analytics https://learn.microsoft.com/en-us/training/modules/ingest-streaming-data-use-azure-stream-analytics-synapse/4-define-query .
By understanding and utilizing Azure Stream Analytics, you can effectively transform streaming data to gain real-time insights and drive informed decisions.
Develop data processing (40–45%)
Ingest and transform data
Data Cleansing Overview
Data cleansing is a critical step in the data preparation process, involving the detection and correction (or removal) of errors and inconsistencies in data to improve its quality. The goal is to ensure that the data is accurate, complete, and reliable for analysis and decision-making.
Cleansing Data with Apache Spark in Azure Synapse Analytics
Apache Spark within Azure Synapse Analytics offers a robust platform for data cleansing tasks. By utilizing Spark dataframes, data engineers can perform a variety of operations to clean data:
- Loading Data: Data is loaded into Spark dataframes from various sources, such as files in a data lake https://learn.microsoft.com/en-us/training/modules/transform-data-spark-azure-synapse-analytics/1-introduction .
- Transformation: Spark dataframes allow for complex data modifications, such as filtering out invalid entries, filling in missing values, and correcting data formats .
- Saving Transformed Data: After cleansing, the data can be saved back to the data lake or ingested into a data warehouse for further processing https://learn.microsoft.com/en-us/training/modules/transform-data-spark-azure-synapse-analytics/1-introduction .
Implementing Data Cleansing in a Data Warehouse Load Process
When loading data into a data warehouse, the process typically includes a data cleansing phase:
- Ingestion: New data is ingested into a data lake, with pre-load cleansing or transformations applied as necessary https://learn.microsoft.com/en-us/training/modules/design-multidimensional-schema-to-optimize-analytical-workloads/4-load-data .
- Staging: The cleansed data is then loaded from files into staging tables in the relational data warehouse https://learn.microsoft.com/en-us/training/modules/design-multidimensional-schema-to-optimize-analytical-workloads/4-load-data .
- Dimension and Fact Table Loading: Dimension tables are updated or populated with new rows, and fact tables are loaded with data, ensuring that surrogate keys are correctly assigned https://learn.microsoft.com/en-us/training/modules/design-multidimensional-schema-to-optimize-analytical-workloads/4-load-data .
- Post-load Optimization: Finally, indexes and table distribution statistics are updated to optimize query performance https://learn.microsoft.com/en-us/training/modules/design-multidimensional-schema-to-optimize-analytical-workloads/4-load-data .
Serverless SQL Pools for Data Cleansing
Azure Synapse Analytics also includes serverless SQL pools, which can be used for querying and cleansing data directly in a data lake:
- Serverless SQL pools enable querying data in various file formats using SQL without loading the data into a database https://learn.microsoft.com/en-us/training/modules/query-data-lake-using-azure-synapse-serverless-sql-pools/1-introduction .
- This feature is particularly useful for data analysts and engineers who need to clean and process file data using familiar SQL syntax https://learn.microsoft.com/en-us/training/modules/query-data-lake-using-azure-synapse-serverless-sql-pools/1-introduction .
Data Lake Storage Considerations
When planning for a data lake, which is often the repository for the data to be cleansed, it is important to consider:
- Data redundancy and availability using Azure Blob replication models like LRS and GRS https://learn.microsoft.com/en-us/training/modules/introduction-to-azure-data-lake-storage/2-azure-data-lake-gen2 .
- Thoughtful consideration of data lake structure, governance, and security to prevent it from becoming a “data swamp” https://learn.microsoft.com/en-us/training/modules/introduction-to-azure-data-lake-storage/2-azure-data-lake-gen2 .
Additional Resources
For more information on data cleansing and related processes, you can refer to the following resources:
- Apache Spark in Azure Synapse Analytics
- Load data into a relational data warehouse https://learn.microsoft.com/en-us/training/modules/design-multidimensional-schema-to-optimize-analytical-workloads/4-load-data .
- Serverless SQL pool in Azure Synapse Analytics
- Best practices for Azure Data Lake
By following these guidelines and utilizing the tools provided by Azure Synapse Analytics, data professionals can effectively cleanse data to ensure its quality for downstream processes.
Develop data processing (40–45%)
Ingest and transform data
Handling Duplicate Data
When working with large datasets, especially in big data analytics, it’s common to encounter duplicate data. Handling duplicate data is crucial to ensure the accuracy and reliability of analytical results. Here are some strategies and tools available in Azure Data Lake Storage Gen2 and related Azure services to manage duplicate data:
- Identify Duplicate Data:
- Utilize Azure Data Lake Storage Gen2’s ability to handle massive volumes of data to scan and identify duplicates. This can be done through custom scripts or by leveraging data processing frameworks like Azure Databricks or Azure HDInsight, which can process data stored in Data Lake Storage Gen2 https://learn.microsoft.com/en-us/training/modules/introduction-to-azure-data-lake-storage/2-azure-data-lake-gen2 https://learn.microsoft.com/en-us/training/modules/introduction-to-azure-data-lake-storage/2-azure-data-lake-gen2 .
- De-duplication Strategies:
- Implement de-duplication logic in the data ingestion process. This can be achieved by using Azure Data Factory or Azure Synapse Analytics pipelines to include steps that remove duplicates during the Extract, Transform, Load (ETL) process https://learn.microsoft.com/en-us/training/modules/introduction-to-azure-data-lake-storage/6-use-cases .
- Use of Delta Lake Tables:
- Delta Lake provides ACID transactions, scalable metadata handling, and unifies streaming and batch data processing. The underlying data for Delta Lake tables is stored in Parquet format, which is commonly used in data lake ingestion pipelines. You can use the serverless SQL pool in Azure Synapse Analytics to query Delta Lake tables in SQL and handle duplicates https://learn.microsoft.com/en-us/training/modules/use-delta-lake-azure-synapse-analytics/2-understand-delta-lake .
- External Tables and Data Lakehouse Architecture:
- In some cases, the data warehouse uses external tables to define a relational metadata layer over files in the data lake, creating a “data lakehouse” architecture. This approach allows for the management of duplicates by defining business rules at the metadata layer https://learn.microsoft.com/en-us/training/modules/introduction-to-azure-data-lake-storage/6-use-cases .
- Data Lifecycle Management:
- Azure Data Lake Storage integrates with Azure Blob storage capabilities, which include tiering and data lifecycle management. These features can be used to manage and delete duplicate data according to defined policies https://learn.microsoft.com/en-us/training/modules/introduction-to-azure-data-lake-storage/2-azure-data-lake-gen2 .
For additional information on Azure Data Lake Storage Gen2 and its capabilities, you can refer to the following resources: - Introduction to Azure Data Lake Storage Gen2 https://learn.microsoft.com/en-us/training/modules/introduction-to-azure-data-lake-storage/8-summary .
By implementing these strategies, you can effectively handle duplicate data within your big data analytics solutions, ensuring that your data is accurate and your analytics are reliable.
Develop data processing (40–45%)
Ingest and transform data
Avoiding Duplicate Data with Azure Stream Analytics Exactly Once Delivery
Azure Stream Analytics is a powerful service designed for complex event processing and analysis of streaming data. One of the key features of Azure Stream Analytics is its ability to guarantee exactly once event processing and at-least-once event delivery https://learn.microsoft.com/en-us/training/modules/introduction-to-data-streaming/3-event-processing . This feature is crucial for scenarios where duplicate data can lead to inaccurate results or skewed analytics.
Exactly Once Event Processing
The exactly once event processing ensures that each event is processed only one time, even in the case of retries or system failures. This is achieved through built-in recovery capabilities and checkpointing mechanisms that maintain the state of your Stream Analytics job. If the delivery of an event fails, the system can recover and reprocess the event without introducing duplicates https://learn.microsoft.com/en-us/training/modules/introduction-to-data-streaming/3-event-processing .
At-Least-Once Event Delivery
In addition to the exactly once processing, Azure Stream Analytics also provides at-least-once event delivery. This means that no events are lost during transmission; they are delivered at least once to the specified output. If an event is not successfully delivered on the first attempt, the system will retry until the event is successfully stored in the output https://learn.microsoft.com/en-us/training/modules/introduction-to-data-streaming/3-event-processing .
Built-in Checkpointing
Checkpointing is a feature that helps in maintaining the state of a Stream Analytics job. It periodically captures the state of the job, including information about which events have been processed. This allows the job to produce repeatable results and ensures that events are not processed more than once, thus avoiding duplicates https://learn.microsoft.com/en-us/training/modules/introduction-to-data-streaming/3-event-processing .
Integration with Various Sources and Destinations
Azure Stream Analytics is integrated with various sources and destinations, which simplifies the setup of exactly once processing and at-least-once delivery. Inputs can include Azure Event Hubs, Azure IoT Hubs, and Azure Blob or Data Lake Gen 2 Storage, each providing metadata fields that assist in event tracking and timestamping https://learn.microsoft.com/en-us/training/modules/visualize-real-time-data-azure-stream-analytics-power-bi/2-power-bi-output https://learn.microsoft.com/en-us/training/modules/ingest-streaming-data-use-azure-stream-analytics-synapse/3-configure-inputs-outputs .
Additional Resources
For more information on setting up and configuring inputs to avoid duplicate data, you can refer to the Azure Stream Analytics documentation on defining inputs: Stream data as input into Stream Analytics https://learn.microsoft.com/en-us/training/modules/visualize-real-time-data-azure-stream-analytics-power-bi/2-power-bi-output https://learn.microsoft.com/en-us/training/modules/ingest-streaming-data-use-azure-stream-analytics-synapse/3-configure-inputs-outputs .
To understand more about the checkpointing mechanism and how it contributes to exactly once processing, you can explore the Azure Stream Analytics documentation on recovery and checkpointing.
By leveraging these features of Azure Stream Analytics, you can ensure that your streaming data is processed accurately, without the introduction of duplicate data, which is essential for maintaining the integrity of your data analytics pipeline.
Develop data processing (40–45%)
Ingest and transform data
Handling Missing Data
When dealing with large datasets, it is common to encounter missing data. Handling missing data effectively is crucial to ensure the integrity of data analysis and processing. Here are some strategies to manage missing data:
Identification: The first step is to identify the missing data within your dataset. This can be done by scanning the dataset for null values or placeholders that indicate missing information.
Analysis: Once identified, analyze the pattern of the missing data. Determine if the data is missing completely at random, missing at random, or missing not at random. This analysis will guide the choice of the handling method.
Imputation: Imputation involves replacing missing data with substituted values. The choice of imputation method depends on the nature of the data and the analysis being performed. Common imputation techniques include:
- Mean/Median/Mode imputation: Replacing missing values with the mean, median, or mode of the non-missing values.
- Predictive models: Using statistical models such as regression to predict and fill in missing values based on other available data.
- Hot-deck imputation: Filling in a missing value with a random but similar value from the dataset.
Deletion: In some cases, it may be appropriate to simply delete records with missing data, especially if the missing data is not random and would bias the results. This can be done by:
- Listwise deletion: Removing entire records where any single value is missing.
- Pairwise deletion: Using all available data without deleting entire records, which can be useful in correlation or regression analysis.
Data Collection Review: Review the data collection process to identify and rectify the causes of missing data. This can prevent the issue from recurring in future datasets.
Documentation: Document the methods used to handle missing data, including the rationale for choosing a particular method. This ensures transparency and reproducibility in data analysis.
For more information on handling missing data and best practices in data management, you can refer to the following resources: - Guidance for designing distributed tables using dedicated SQL pool in Azure Synapse Analytics https://learn.microsoft.com/en-us/training/modules/design-multidimensional-schema-to-optimize-analytical-workloads/3-create-tables . - Azure Synapse Analytics documentation for creating and managing lake databases and applying data modeling principles https://learn.microsoft.com/en-us/training/modules/create-metadata-objects-azure-synapse-serverless-sql-pools/2-lake-database .
Remember, the chosen method for handling missing data should align with the overall data strategy and the specific requirements of the analysis or processing task at hand.
Develop data processing (40–45%)
Ingest and transform data
Handling Late-Arriving Data
In data processing systems, late-arriving data refers to data that does not arrive within the expected time frame for processing. This can occur due to various reasons such as network delays, system outages, or simply because the data is generated much later than the event it represents. Handling late-arriving data is crucial to ensure the accuracy and completeness of data analytics and reporting.
When designing a system to handle late-arriving data, consider the following strategies:
Windowing: Implement windowing techniques that allow for a period during which data can arrive late. This means that the system will wait for a specified time before finalizing the processing of data for a particular window of time.
Reprocessing: Design the system to support reprocessing of data. This allows the system to incorporate late-arriving data by re-running computations for the affected time periods.
Versioning: Keep track of different versions of the processed data. When late-arriving data is processed, it can result in a new version of the data, ensuring that the most up-to-date and accurate information is available.
Event Time vs. Processing Time: Differentiate between event time (the time when the event actually occurred) and processing time (the time when the event is processed). This distinction helps in managing and compensating for late-arriving data.
State Management: Maintain state information that can be used to update the results when late data arrives. This might involve using stateful processing systems that can handle such updates efficiently.
Monitoring and Alerts: Implement monitoring and alerting mechanisms to detect and notify when late data arrives. This can help in taking timely action to ensure data is processed correctly.
For additional information on handling late-arriving data, refer to the following resources:
- Windowing in stream processing
- Reprocessing patterns in Azure Data Lake
- Event time processing in Azure Stream Analytics
By incorporating these strategies into your data processing design, you can mitigate the impact of late-arriving data and maintain the integrity of your data analytics.
Please note that the URLs provided are for reference purposes and are part of the study material related to Azure data services and handling late-arriving data.
Develop data processing (40–45%)
Ingest and transform data
Split Data
Splitting data is a crucial process in data management and analytics, particularly when dealing with large datasets. It involves dividing data into more manageable parts or segments based on specific criteria. This can enhance performance, facilitate parallel processing, and make data more accessible for analysis. Below are some key concepts and methods related to splitting data:
Dataframe Operations
When working with dataframes, such as those in Apache Spark, you can perform various operations to manipulate and transform the data. These operations include:
- Filtering rows and columns: Selecting specific subsets of data based on certain conditions.
- Renaming columns: Changing the names of columns to make them more descriptive or to follow certain naming conventions.
- Creating new columns: Generating new columns from existing ones, often by applying some form of computation or transformation.
- Replacing null or other values: Handling missing or undesirable data by replacing them with default or calculated values.
For example, you might split a single column into multiple columns
using the split function. Here’s a code snippet that
demonstrates how to split a CustomerName column into
FirstName and LastName columns, and then drop
the original CustomerName column:
from pyspark.sql.functions import split, col
# Create the new FirstName and LastName fields
transformed_df = order_details.withColumn("FirstName", split(col("CustomerName"), " ").getItem(0)) \
.withColumn("LastName", split(col("CustomerName"), " ").getItem(1))
# Remove the CustomerName field
transformed_df = transformed_df.drop("CustomerName")
display(transformed_df.limit(5))Data Lake Partitioning
Partitioning data in a data lake is another common method of splitting data. It involves organizing data into subfolders that reflect partitioning criteria, such as date or region. This structure allows distributed processing systems to work in parallel on different partitions or to skip certain partitions based on query criteria.
For instance, you might partition sales order data by year and month to improve the efficiency of processing queries that filter orders based on these time periods. Here’s an example of how data could be partitioned in a data lake:
/orders
/year=2020
/month=1
/01012020.parquet
/02012020.parquet
...
/month=2
/01022020.parquet
/02022020.parquet
...
/year=2021
/month=1
/01012021.parquet
/02012021.parquet
...To query this partitioned data and include only orders for January and February 2020, you could use SQL code like the following:
SELECT *
FROM OPENROWSET(
BULK 'https://mydatalake.blob.core.windows.net/data/orders/year=*/month=*/*.*',
FORMAT = 'parquet'
) AS orders
WHERE orders.filepath(1) = '2020' AND orders.filepath(2) IN ('1','2');In this SQL query, the filepath parameters correspond to
the partitioned folder names, allowing the query to target specific
partitions.
Additional Resources
For more information on data transformation and partitioning, you can refer to the following resources:
By understanding and applying these methods of splitting data, you can optimize your data storage and processing workflows, leading to more efficient and effective data analysis.
Develop data processing (40–45%)
Ingest and transform data
Shredding JSON Data
When working with JSON data in modern web applications and services, it’s common to store and exchange data in this format. JSON, or JavaScript Object Notation, is a lightweight data-interchange format that is easy for humans to read and write, and easy for machines to parse and generate. In the context of data analysis and processing, “shredding” JSON refers to the process of decomposing and converting JSON data into a tabular format that can be queried and analyzed using SQL or other data processing languages.
Using OPENROWSET to Shred JSON
To shred JSON data in Azure, you can use the OPENROWSET
function with a SQL query. This function allows you to read data from
external sources, such as files in a data lake. For instance, if you
have a folder containing multiple JSON files with product data, you can
use the following SQL query to return the data:
SELECT doc
FROM OPENROWSET(
BULK 'https://mydatalake.blob.core.windows.net/data/files/*.json',
FORMAT = 'csv',
FIELDTERMINATOR ='0x0b',
FIELDQUOTE = '0x0b',
ROWTERMINATOR = '0x0b'
) WITH (doc NVARCHAR(MAX)) as rowsSince OPENROWSET does not have a specific format for
JSON files, you must use the CSV format with special terminators, and
define a schema that includes a single NVARCHAR(MAX) column
to handle the JSON documents https://learn.microsoft.com/en-us/training/modules/query-data-lake-using-azure-synapse-serverless-sql-pools/3-query-files
.
Extracting Values from JSON
To extract specific values from the JSON data, you can use the
JSON_VALUE function in your SQL query. This function
extracts a scalar value from a JSON string. Here’s an example of how to
use it to get the product name and list price from the JSON
documents:
SELECT JSON_VALUE(doc, '$.product_name') AS product,
JSON_VALUE(doc, '$.list_price') AS price
FROM OPENROWSET(
BULK 'https://mydatalake.blob.core.windows.net/data/files/*.json',
FORMAT = 'csv',
FIELDTERMINATOR ='0x0b',
FIELDQUOTE = '0x0b',
ROWTERMINATOR = '0x0b'
) WITH (doc NVARCHAR(MAX)) as rowsThis query would return a rowset with columns for product and price, allowing you to work with the data as if it were in a relational database table https://learn.microsoft.com/en-us/training/modules/query-data-lake-using-azure-synapse-serverless-sql-pools/3-query-files .
Additional Resources
For more information on working with JSON data in Azure and the
OPENROWSET function, you can refer to the following
resources:
By shredding JSON data, you can leverage the powerful analytical capabilities of SQL on semi-structured JSON data, making it a valuable skill for data professionals working with modern data platforms like Azure.
Develop data processing (40–45%)
Ingest and transform data
Encode and Decode Data
Encoding and decoding data are essential processes in handling various data formats within a data platform. These processes are particularly relevant when dealing with text data that can come in different encodings, such as UTF-8, which may need to be converted to match the encoding expected by a database system.
Understanding Data Encoding
Data encoding refers to the method by which data is converted into a specific format that is suitable for storage, transmission, and consumption by different systems. For example, text data can be encoded in ASCII, UTF-8, UTF-16, or other character sets, depending on the language and the characters required.
Encoding in Azure Synapse Analytics
In Azure Synapse Analytics, you may encounter scenarios where you need to import text data encoded in formats like UTF-8 into your database. To facilitate this, you can set the collation of your database to support the conversion of text data into appropriate Transact-SQL data types. For instance, creating a database with a collation that supports UTF-8 can be done using the following SQL statement:
CREATE DATABASE SalesDB COLLATE Latin1_General_100_BIN2_UTF8Decoding Data
Decoding is the reverse process of encoding, where encoded data is converted back to its original form. This is often necessary when retrieving data from a database or a file and presenting it in a human-readable format or passing it to another system that requires a different encoding.
Handling Delimited Text Files
Delimited text files, such as CSV files, are commonly used to store
and exchange data. These files can have various encodings and may
include headers, different delimiters, and line endings. Azure Synapse
Analytics provides the OPENROWSET function to read data
from delimited text files with the csv FORMAT parameter.
This function allows you to specify the parser version, which determines
how text encoding is interpreted. For example:
SELECT TOP 100 *
FROM OPENROWSET(
BULK 'https://mydatalake.blob.core.windows.net/data/files/*.csv',
FORMAT = 'csv',
PARSER_VERSION = '2.0',
FIRSTROW = 2
) AS rowsSpecifying Column Names and Data Types
When a delimited text file includes column names in the first row,
the OPENROWSET function can use this information to define
the schema for the resulting rowset and automatically infer the data
types of the columns. If the file does not contain column names, you can
provide a schema definition using a WITH clause to specify
explicit column names and data types:
SELECT TOP 100 *
FROM OPENROWSET(
BULK 'https://mydatalake.blob.core.windows.net/data/files/*.csv',
FORMAT = 'csv',
PARSER_VERSION = '2.0'
)
WITH (
product_id INT,
product_name VARCHAR(20) COLLATE Latin1_General_100_BIN2_UTF8,
list_price DECIMAL(5,2)
) AS rowsAdditional Resources
For more details on working with delimited text files and handling encoding and decoding in Azure Synapse Analytics, refer to the Azure Synapse Analytics documentation: - OPENROWSET function and CSV format https://learn.microsoft.com/en-us/training/modules/query-data-lake-using-azure-synapse-serverless-sql-pools/3-query-files . - Troubleshooting UTF-8 text incompatibilities https://learn.microsoft.com/en-us/training/modules/query-data-lake-using-azure-synapse-serverless-sql-pools/3-query-files .
By understanding and applying these concepts, you can effectively manage the encoding and decoding of data within your data platform, ensuring compatibility and proper data interpretation across different systems and services.
Develop data processing (40–45%)
Ingest and transform data
Configure Error Handling for a Transformation
When configuring error handling for a transformation within Azure Synapse Analytics, it is essential to understand the mechanisms available to manage and respond to errors that may occur during data movement and processing tasks. Azure Synapse Analytics pipelines provide a robust set of activities that can be orchestrated to handle errors gracefully.
Error Handling in Pipelines: Pipelines in Azure Synapse Analytics allow you to define a sequence of activities for data transfer and transformation. To manage errors within these pipelines, you can use control flow activities that enable branching and looping based on the success or failure of the activities. The graphical design tools in Azure Synapse Studio facilitate the creation of complex pipelines, where error handling can be visually orchestrated with minimal coding https://learn.microsoft.com/en-us/training/modules/build-data-pipeline-azure-synapse-analytics/2-understand-pipelines-azure-synapse-analytics .
Using Activities for Error Handling: Activities within a pipeline can be configured to handle errors by specifying fault tolerance settings. For instance, you can set up retry policies on activities that might fail due to transient issues, allowing the activity to be retried a specified number of times before being considered failed. Additionally, you can configure timeouts to prevent activities from running indefinitely and specify error paths that redirect the flow of execution when an activity fails.
Monitoring and Logging: Monitoring and logging are crucial for error handling. Azure Synapse Analytics provides monitoring features that allow you to track the status of pipeline runs and view detailed logs. These logs can be used to identify the root cause of errors and to inform the design of your error handling strategy.
Serverless SQL Pool for Data Transformation: For data transformations using SQL, the serverless SQL pool in Azure Synapse Analytics offers an interactive way to perform SQL-based data transformations. This can be particularly useful for handling transformation errors, as SQL provides a familiar and powerful language for specifying error handling logic within your queries https://learn.microsoft.com/en-us/training/modules/query-data-lake-using-azure-synapse-serverless-sql-pools/2-understand-serverless-pools .
Integrating with Apache Spark: Apache Spark, integrated within Azure Synapse Analytics, is another powerful tool for data processing and analytics. Spark provides fault-tolerant processing by design, which can be leveraged to handle errors during transformations. When using Spark in Azure Synapse Analytics, you can configure Spark pools and run code in Spark notebooks to process data with built-in error handling capabilities https://learn.microsoft.com/en-us/training/modules/understand-big-data-engineering-with-apache-spark-azure-synapse-analytics/1-introduction .
Best Practices for Error Handling: - Define clear error handling logic within your transformations. - Use retry policies and timeouts to manage transient errors and long-running activities. - Monitor pipeline runs and review logs to quickly identify and address errors. - Leverage the capabilities of serverless SQL pools and Apache Spark for robust error handling. - Apply data modeling principles to ensure data integrity and reduce the likelihood of transformation errors https://learn.microsoft.com/en-us/training/modules/create-metadata-objects-azure-synapse-serverless-sql-pools/2-lake-database .
For additional information on configuring error handling within Azure Synapse Analytics, you can refer to the following resources: - Azure Synapse Analytics documentation - Serverless SQL pool in Azure Synapse Analytics - Apache Spark in Azure Synapse Analytics
Please note that the URLs provided are for reference purposes and are not to be included in the study guide.
Develop data processing (40–45%)
Ingest and transform data
Normalize and Denormalize Data
Normalization and denormalization are two fundamental concepts in database design that are used to optimize the structure of a database.
Normalization
Normalization is a process used in transactional databases to minimize data redundancy and dependency by organizing fields and table of a database according to a set of rules. It involves dividing a database into two or more tables and defining relationships between the tables. The aim is to isolate data so that additions, deletions, and modifications of a field can be made in just one table and then propagated through the rest of the database via the defined relationships.
Denormalization
Denormalization, on the other hand, is a strategy used in data warehousing to improve the performance of a database infrastructure. It involves combining multiple table data into one so that queries can retrieve data faster due to the reduction of the number of joins needed. In a data warehouse, dimension data is generally denormalized for this reason https://learn.microsoft.com/en-us/training/modules/design-multidimensional-schema-to-optimize-analytical-workloads/2-design-implement-star-schema .
Star Schema
A common organizational structure for a denormalized database is the star schema. In a star schema, a central fact table contains the core data, and it is directly linked to a set of dimension tables. This simplifies the database design and reduces the number of joins required to fetch data, which can significantly improve query performance https://learn.microsoft.com/en-us/training/modules/design-multidimensional-schema-to-optimize-analytical-workloads/2-design-implement-star-schema .
Snowflake Schema
The snowflake schema is a variation of the star schema where some normalization is applied to the dimension tables. This can be useful when an entity has a large number of hierarchical attribute levels or when attributes can be shared by multiple dimensions. In a snowflake schema, the dimension tables are normalized into multiple related tables, which can lead to more complex queries due to the additional joins required https://learn.microsoft.com/en-us/training/modules/design-multidimensional-schema-to-optimize-analytical-workloads/2-design-implement-star-schema .
Azure Synapse Analytics
Azure Synapse Analytics is a service that supports both relational data warehouses and big data analytics. It provides dedicated SQL pools that are optimized for large volumes of data and complex queries, which can be beneficial when dealing with denormalized data structures https://learn.microsoft.com/en-us/training/modules/design-multidimensional-schema-to-optimize-analytical-workloads/1-introduction .
Lake Database
A lake database combines the benefits of a relational schema with the flexibility of file storage in a data lake. It allows for the use of relational database semantics while maintaining the scalability and flexibility of a data lake https://learn.microsoft.com/en-us/training/modules/create-metadata-objects-azure-synapse-serverless-sql-pools/8-summary .
Delta Lake
Delta Lake is an open-source storage layer that brings relational database capabilities to data lakes. It is supported in Azure Synapse Analytics and can be used to enforce schema, maintain data integrity, and improve query performance https://learn.microsoft.com/en-us/training/modules/use-delta-lake-azure-synapse-analytics/2-understand-delta-lake .
For more information on these concepts and how they are implemented in Azure Synapse Analytics, you can refer to the following resources: - Design a Multidimensional Schema to Optimize Analytical Workloads - Azure Synapse Analytics Documentation - Delta Lake Documentation
Please note that the URLs provided are for additional information and are not to be explicitly mentioned in the study guide.
Develop data processing (40–45%)
Ingest and transform data
Performing data exploratory analysis is a critical step in understanding the underlying patterns, relationships, and insights within a dataset. This process typically involves a series of actions that allow data analysts to familiarize themselves with the data, identify any potential issues, and determine the best paths for deeper analysis. Here is a detailed explanation of the steps involved in performing data exploratory analysis:
Data Exploration Steps
Data Profiling: Begin by examining the basic characteristics of the data. This includes understanding the data types, range of values, and identifying any missing or null values. Data profiling helps in assessing the quality of the data and in planning for any necessary data cleaning steps.
Statistical Summary: Generate descriptive statistics to summarize the central tendency, dispersion, and shape of the dataset’s distribution. This includes measures like mean, median, mode, standard deviation, variance, and quantiles.
Visualization: Use graphical representations to understand the data better. Common visualizations include histograms, box plots, scatter plots, and bar charts. These tools help in identifying trends, outliers, and patterns that may not be apparent from raw data.
Correlation Analysis: Determine the relationships between variables. This can be done using correlation coefficients for numerical data or contingency tables for categorical data. Understanding these relationships is crucial for feature selection and modeling.
Data Cleaning: Based on the insights gained from the above steps, clean the data by handling missing values, removing duplicates, and correcting errors. This step ensures that the data is accurate and ready for further analysis.
Feature Engineering: Create new variables or modify existing ones to better capture the underlying structure of the data. This may involve combining variables, creating categorical bins, or transforming variables for better model performance.
Dimensionality Reduction: In cases of high-dimensional data, apply techniques like Principal Component Analysis (PCA) or t-Distributed Stochastic Neighbor Embedding (t-SNE) to reduce the number of variables while retaining the essential information.
Tools and Technologies
Azure Synapse Analytics: Utilize Apache Spark pools within Azure Synapse Analytics for data transformation and preparation tasks. Spark’s dataframe object is particularly useful for handling large volumes of data https://learn.microsoft.com/en-us/training/modules/transform-data-spark-azure-synapse-analytics/1-introduction .
SQL Database Tools: For data stored in relational databases, use SQL queries to perform exploratory analysis. Tools like the
OPENROWSETfunction and the creation of external tables can simplify access to data for analysis https://learn.microsoft.com/en-us/training/modules/query-data-lake-using-azure-synapse-serverless-sql-pools/4-external-objects .Data Lineage Tools: Microsoft Purview provides visual representations of data lineage, which can be helpful in understanding the data pipeline and ensuring data quality https://learn.microsoft.com/en-us/training/modules/intro-to-microsoft-purview/3-how-microsoft-purview-works .
Additional Resources
For more information on the tools and techniques mentioned above, you can refer to the following URLs:
- Azure Synapse Analytics: Apache Spark in Azure Synapse Analytics
- SQL Data Exploration: Querying files in the data lake with SQL
- Data Lineage with Microsoft Purview: Introduction to Microsoft Purview
By following these steps and utilizing the appropriate tools, data analysts can conduct thorough exploratory analysis, which is essential for making informed decisions and driving insights from data.
Develop data processing (40–45%)
Develop a batch processing solution
Develop Batch Processing Solutions Using Azure Services
Batch processing is a critical component of data analytics, allowing for the efficient processing of large volumes of data. Azure provides a suite of services that can be leveraged to create robust batch processing solutions. Below is an explanation of how each service contributes to this process:
Azure Data Lake Storage
Azure Data Lake Storage Gen2 is a large-scale data lake solution that combines the scalability and cost-effectiveness of Azure Blob storage with a hierarchical namespace and is highly optimized for analytics workloads. It serves as the foundational storage layer where batch data can be stored in its native format, regardless of size. This data can then be processed using various analytics engines https://learn.microsoft.com/en-us/training/modules/introduction-to-azure-data-lake-storage/6-use-cases .
Azure Databricks
Azure Databricks is an Apache Spark-based analytics platform optimized for the Microsoft Azure cloud services platform. It provides a collaborative environment with a workspace for developing data engineering, data science, and machine learning solutions. In batch processing, Azure Databricks can be used to ingest, process, and analyze large volumes of data efficiently, leveraging Spark’s in-memory processing capabilities to handle complex ETL operations and analytics https://learn.microsoft.com/en-us/training/modules/understand-big-data-engineering-with-apache-spark-azure-synapse-analytics/1-introduction .
Azure Synapse Analytics
Azure Synapse Analytics is an integrated analytics service that accelerates time to insight across data warehouses and big data systems. It allows you to ingest, prepare, manage, and serve data for immediate BI and machine learning needs. Within Synapse, you can use Spark pools to perform batch processing tasks, and you can combine this with data from other sources, such as operational databases, using Synapse Link https://learn.microsoft.com/en-us/training/modules/ingest-streaming-data-use-azure-stream-analytics-synapse/5-run-job-ingest https://learn.microsoft.com/en-us/training/modules/understand-big-data-engineering-with-apache-spark-azure-synapse-analytics/1-introduction .
Azure Data Factory
Azure Data Factory is a managed cloud service that’s built for complex hybrid extract-transform-load (ETL), extract-load-transform (ELT), and data integration projects. It allows you to create data-driven workflows for orchestrating and automating data movement and data transformation. Azure Synapse Analytics pipelines, which are built on the same technology as Azure Data Factory, can be used to define and manage batch processing workflows, including data movement and transformation activities https://learn.microsoft.com/en-us/training/modules/build-data-pipeline-azure-synapse-analytics/1-introduction https://learn.microsoft.com/en-us/training/modules/build-data-pipeline-azure-synapse-analytics/2-understand-pipelines-azure-synapse-analytics .
For additional information on these services and how they can be used to develop batch processing solutions, you can visit the following URLs: - Azure Data Lake Storage Gen2: Azure Data Lake Storage Gen2 Overview - Azure Databricks: Azure Databricks Documentation - Azure Synapse Analytics: Azure Synapse Analytics Documentation - Azure Data Factory: Azure Data Factory Documentation
By integrating these Azure services, you can build a comprehensive batch processing solution that is scalable, performant, and tailored to your specific data analytics needs.
Develop data processing (40–45%)
Develop a batch processing solution
Use PolyBase to Load Data to a SQL Pool
PolyBase is a technology that enables your SQL database to process Transact-SQL queries that read data from external data sources. In Azure Synapse Analytics, PolyBase allows you to load data efficiently into a dedicated SQL pool (formerly SQL Data Warehouse) from Hadoop, Azure Blob Storage, or Azure Data Lake Store.
To use PolyBase for loading data into a SQL pool, follow these steps:
Create an External Data Source: Define an external data source that points to the Hadoop cluster or the Azure storage where your data resides.
Create an External File Format: Specify the format of the data files (such as CSV, Parquet, or ORC) that you’re going to import using PolyBase.
Create an External Table: This table references the external data source and file format and defines the schema of the data you’re importing.
Create a Database Scoped Credential: If your external data source requires authentication, you’ll need to create a database scoped credential.
Load Data: Use a
CREATE TABLE AS SELECT(CTAS) orINSERT INTOstatement to load the data from the external table into a table within the SQL pool.
Here’s an example of how you might use PolyBase to load data:
-- Create an external data source
CREATE EXTERNAL DATA SOURCE MyAzureBlobStorage
WITH (
TYPE = HADOOP,
LOCATION = 'wasbs://[container]@[storage_account].blob.core.windows.net',
CREDENTIAL = MyAzureBlobStorageCredential
);
-- Create an external file format
CREATE EXTERNAL FILE FORMAT MyFileFormat
WITH (
FORMAT_TYPE = DELIMITEDTEXT,
FORMAT_OPTIONS (FIELD_TERMINATOR = ',', STRING_DELIMITER = '"')
);
-- Create an external table
CREATE EXTERNAL TABLE ExternalTable (
[Column1] INT,
[Column2] NVARCHAR(50),
...
)
WITH (
LOCATION='/data/',
DATA_SOURCE = MyAzureBlobStorage,
FILE_FORMAT = MyFileFormat
);
-- Load data into the SQL pool
CREATE TABLE SQLPoolTable
WITH (
DISTRIBUTION = ROUND_ROBIN,
CLUSTERED COLUMNSTORE INDEX
)
AS
SELECT * FROM ExternalTable;For additional information on using PolyBase to load data into a SQL pool, you can refer to the following resources:
Please note that while PolyBase is a powerful tool for loading large volumes of data, it’s important to understand the requirements and limitations of the technology, such as data format compatibility and network configuration, to ensure a successful data loading process.
Develop data processing (40–45%)
Develop a batch processing solution
Implementing Azure Synapse Link and Querying the Replicated Data
Azure Synapse Link is a service that creates seamless integration between operational databases and Azure Synapse Analytics, enabling real-time analytics over operational data. This service simplifies the architecture for building hybrid transactional and analytical processing (HTAP) solutions by removing the need for complex ETL processes to move data from operational stores to analytical stores.
Configuring Azure Synapse Link
To implement Azure Synapse Link, you must first configure the operational database to enable the link with Azure Synapse Analytics. For Azure Cosmos DB, this involves:
Enabling Azure Synapse Link on Azure Cosmos DB: This can be done either when creating a new Cosmos DB account or by updating an existing account to enable analytical storage https://learn.microsoft.com/en-us/training/modules/configure-azure-synapse-link-with-azure-cosmos-db/2-enable-cosmos-db-account-to-use .
Example Azure CLI command to enable Azure Synapse Link for an existing Cosmos DB account:
az cosmosdb update --name my-cosmos-db --resource-group my-rg --enable-analytical-storage trueIf you are enabling Azure Synapse Link for an Azure Cosmos DB for Apache Gremlin account, you would also include the
--capabilities EnableGremlinparameter https://learn.microsoft.com/en-us/training/modules/configure-azure-synapse-link-with-azure-cosmos-db/2-enable-cosmos-db-account-to-use .Creating an Analytical Store Enabled Container: This container will store the data that is available for analysis https://learn.microsoft.com/en-us/training/modules/configure-azure-synapse-link-with-azure-cosmos-db/1-introduction .
Creating a Linked Service for Azure Cosmos DB: This linked service connects Azure Cosmos DB to Azure Synapse Analytics https://learn.microsoft.com/en-us/training/modules/configure-azure-synapse-link-with-azure-cosmos-db/1-introduction .
For SQL Server 2022, you need to create storage for the landing zone in Azure and configure your SQL Server instance before creating a link connection in Azure Synapse Analytics https://learn.microsoft.com/en-us/training/modules/implement-synapse-link-for-sql/4-synapse-link-sql-server .
Querying Replicated Data
Once Azure Synapse Link is configured, you can query the replicated data using various tools within Azure Synapse Analytics:
Using Spark: You can analyze linked data using Spark in Azure Synapse Analytics. Spark can work with data from various sources, including Azure Cosmos DB analytical databases configured using Azure Synapse Link https://learn.microsoft.com/en-us/training/modules/understand-big-data-engineering-with-apache-spark-azure-synapse-analytics/3-use-spark .
Using Synapse SQL: You can also analyze linked data using Synapse SQL, which allows you to run queries directly on the data replicated from Azure Cosmos DB https://learn.microsoft.com/en-us/training/modules/configure-azure-synapse-link-with-azure-cosmos-db/1-introduction .
Azure Synapse Link supports various data sources, including Azure Cosmos DB, SQL Server, and Dataverse, providing a range of options for operational data stores that can be analyzed in real-time https://learn.microsoft.com/en-us/training/modules/design-hybrid-transactional-analytical-processing-using-azure-synapse-analytics/4-knowledge-check .
For additional information on Azure Synapse Link, you can refer to the following resources:
- Azure Synapse Analytics Link for Cosmos DB
- Azure Synapse Link for SQL Server 2022
- Azure Synapse Link for Dataverse
By leveraging Azure Synapse Link, organizations can gain insights from their operational data in near-real time, enabling better decision-making and more responsive business processes.
Develop data processing (40–45%)
Develop a batch processing solution
Create Data Pipelines
Data pipelines are essential components in data integration and ETL (extract, transform, and load) processes. They enable the orchestration of data movement and transformation activities, allowing for the automation of workflows in analytical solutions. Here’s a detailed explanation of how to create data pipelines using Azure Synapse Analytics:
Azure Synapse Studio Pipeline Creation
- Starting Point: You can initiate the creation of a pipeline directly from the Home page using shortcuts or primarily through the Integrate page within Azure Synapse Studio https://learn.microsoft.com/en-us/training/modules/build-data-pipeline-azure-synapse-analytics/3-create-pipeline-azure-synapse-studio .
- Graphical Interface: Azure Synapse Studio provides a graphical design interface, which includes a pipeline designer. This designer features a variety of activities categorized for easy access, which you can drag onto a visual canvas to construct your pipeline https://learn.microsoft.com/en-us/training/modules/build-data-pipeline-azure-synapse-analytics/3-create-pipeline-azure-synapse-studio .
- Activity Configuration: Each activity placed on the canvas has configurable settings accessible through the properties pane. This allows for the customization of each activity to meet specific requirements of the data workflow https://learn.microsoft.com/en-us/training/modules/build-data-pipeline-azure-synapse-analytics/3-create-pipeline-azure-synapse-studio .
- Defining Activity Sequence: Activities within the pipeline are logically sequenced by connecting them with dependency conditions such as Succeeded, Failed, and Completed. These conditions determine the flow of execution based on the outcome of each activity https://learn.microsoft.com/en-us/training/modules/build-data-pipeline-azure-synapse-analytics/3-create-pipeline-azure-synapse-studio .
Components of Azure Synapse Analytics Pipelines
- Datasets: Datasets define the schema and structure of the data objects used in the pipeline. They are associated with linked services that connect to the data source, and can be inputs or outputs for activities within the pipeline https://learn.microsoft.com/en-us/training/modules/build-data-pipeline-azure-synapse-analytics/2-understand-pipelines-azure-synapse-analytics .
- Linked Services: These are essentially connection strings that point to the data stores or compute resources required by the activities in the pipeline. They are defined at the workspace level and can be reused across multiple pipelines https://learn.microsoft.com/en-us/training/modules/build-data-pipeline-azure-synapse-analytics/2-understand-pipelines-azure-synapse-analytics .
- Apache Spark Integration: For big data processing, Azure Synapse Pipelines can integrate with Apache Spark pools. Spark notebooks can be included in pipelines for running code, which is particularly useful for data transformation tasks in big data analytics solutions https://learn.microsoft.com/en-us/training/modules/use-spark-notebooks-azure-synapse-pipeline/2-understand-notebooks-pipelines https://learn.microsoft.com/en-us/training/modules/use-spark-notebooks-azure-synapse-pipeline/1-introduction .
Best Practices for Using Spark Notebooks in Pipelines
- Code Organization: Maintain clear and descriptive naming for variables and functions, and structure your code into manageable, reusable segments https://learn.microsoft.com/en-us/training/modules/use-spark-notebooks-azure-synapse-pipeline/2-understand-notebooks-pipelines .
- Caching: Utilize Spark’s ability to cache intermediate results to enhance the performance of your notebooks https://learn.microsoft.com/en-us/training/modules/use-spark-notebooks-azure-synapse-pipeline/2-understand-notebooks-pipelines .
- Computation Optimization: Be mindful of the computations you perform to avoid unnecessary steps, such as filtering data early in the process https://learn.microsoft.com/en-us/training/modules/use-spark-notebooks-azure-synapse-pipeline/2-understand-notebooks-pipelines .
- Avoid collect(): When dealing with large datasets, it’s better to operate on the entire dataset rather than using the collect() method to bring data into the driver node https://learn.microsoft.com/en-us/training/modules/use-spark-notebooks-azure-synapse-pipeline/2-understand-notebooks-pipelines .
- Monitoring with Spark UI: Use Spark’s web-based UI to monitor and debug your Spark jobs, which provides insights into task execution times and data sizes https://learn.microsoft.com/en-us/training/modules/use-spark-notebooks-azure-synapse-pipeline/2-understand-notebooks-pipelines .
- Dependency Management: Ensure that dependencies are version-consistent and updated to the latest versions for optimal performance with Spark https://learn.microsoft.com/en-us/training/modules/use-spark-notebooks-azure-synapse-pipeline/2-understand-notebooks-pipelines .
Additional Resources
For further information on creating and managing data pipelines in Azure Synapse Analytics, you can refer to the following resources:
- Build a data pipeline with Azure Synapse Analytics https://learn.microsoft.com/en-us/training/modules/build-data-pipeline-azure-synapse-analytics/3-create-pipeline-azure-synapse-studio .
- Data integration in Azure Synapse Analytics versus Azure Data Factory https://learn.microsoft.com/en-us/training/modules/build-data-pipeline-azure-synapse-analytics/1-introduction .
- Use Spark notebooks in an Azure Synapse Pipeline https://learn.microsoft.com/en-us/training/modules/use-spark-notebooks-azure-synapse-pipeline/2-understand-notebooks-pipelines .
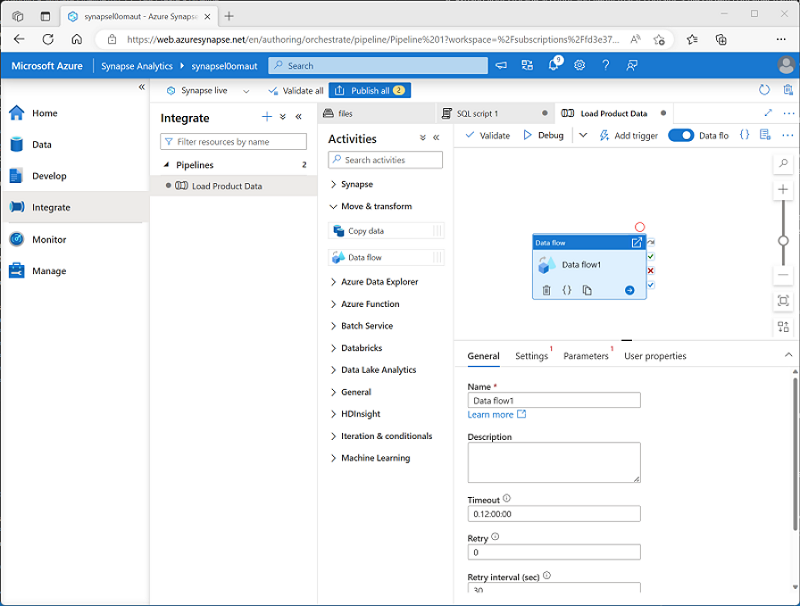
By following these guidelines and utilizing the resources provided, you can effectively create robust data pipelines that are integral to data integration and analytical solutions.
Develop data processing (40–45%)
Develop a batch processing solution
Scale Resources
In the realm of data analytics, scaling resources is a critical aspect of managing and optimizing the performance and cost of data processing systems. Azure Synapse Analytics, a service that offers comprehensive data integration capabilities, allows for the scaling of resources to meet the demands of enterprise data analytics.
Pipelines
Azure Synapse Analytics utilizes pipelines to implement complex extract, transform, and load (ETL) solutions. These pipelines are designed to orchestrate data movement activities and can be scaled to handle varying workloads. The ability to automate ETL workloads as a regular process is essential for maintaining efficiency in a larger analytical solution https://learn.microsoft.com/en-us/training/modules/build-data-pipeline-azure-synapse-analytics/8-summary https://learn.microsoft.com/en-us/training/modules/build-data-pipeline-azure-synapse-analytics/1-introduction .
For more information on developing and debugging pipelines, you can refer to the following URL: Iterative development and debugging with Azure Data Factory and Synapse Analytics pipelines https://learn.microsoft.com/en-us/training/modules/build-data-pipeline-azure-synapse-analytics/8-summary .
Data Lake Storage
Azure Data Lake Storage is structured in a hierarchical manner, similar to a file system, which allows for efficient data processing with reduced computational resources. This structure contributes to the scalability of the system by minimizing the time and cost associated with data processing https://learn.microsoft.com/en-us/training/modules/introduction-to-azure-data-lake-storage/2-azure-data-lake-gen2 .
Serverless SQL Pool
The serverless SQL pool in Azure Synapse Analytics provides a scalable pay-per-query model for querying data. It offers several benefits that support resource scaling:
- Query data in place using familiar Transact-SQL syntax without the need for data movement.
- Connect from a variety of business intelligence and querying tools.
- Distributed query processing designed for large-scale data.
- Built-in query execution fault-tolerance for high reliability.
- No infrastructure setup or cluster maintenance required.
- Pay only for the data processed by the queries you run https://learn.microsoft.com/en-us/training/modules/query-data-lake-using-azure-synapse-serverless-sql-pools/2-understand-serverless-pools .
For additional details on serverless SQL pool, the following URL may be useful: Serverless SQL pool in Azure Synapse Analytics https://learn.microsoft.com/en-us/training/modules/query-data-lake-using-azure-synapse-serverless-sql-pools/2-understand-serverless-pools .
Data Flow
Data flows within Azure Synapse Analytics are another key feature that supports resource scaling. They consist of sources, transformations, and sinks, which define the input, processing, and output of data, respectively. Data flows are scalable and can be debugged to ensure proper column mappings and data types during development https://learn.microsoft.com/en-us/training/modules/build-data-pipeline-azure-synapse-analytics/4-define-data-flows .
To learn more about implementing a Data Flow activity, visit: Data Flow activity in Azure Data Factory and Azure Synapse Analytics https://learn.microsoft.com/en-us/training/modules/build-data-pipeline-azure-synapse-analytics/4-define-data-flows .
Scaling resources effectively in Azure Synapse Analytics involves leveraging these features to adjust to workload demands, optimize performance, and control costs.
Develop data processing (40–45%)
Develop a batch processing solution
Configure the Batch Size
When configuring the batch size for data processing, it is essential to understand the context in which the data is being ingested and processed. Batch size refers to the amount of data that is collected and processed as a group in one execution cycle. The configuration of batch size can significantly impact the performance and efficiency of data processing systems.
In Azure Synapse Analytics, you can work with streaming data just as you would with batch-processed data, combining it with other data sources for comprehensive analytics https://learn.microsoft.com/en-us/training/modules/ingest-streaming-data-use-azure-stream-analytics-synapse/5-run-job-ingest . Azure Data Lake Storage Gen2 is capable of handling large volumes of data at exabyte scale and is suitable for both real-time and batch processing solutions https://learn.microsoft.com/en-us/training/modules/introduction-to-azure-data-lake-storage/2-azure-data-lake-gen2 . This flexibility allows for the configuration of batch sizes that are optimized for the specific requirements of the solution.
For batch data movement, technologies such as Azure Synapse Analytics or Azure Data Factory pipelines are commonly used https://learn.microsoft.com/en-us/training/modules/introduction-to-azure-data-lake-storage/5-stages-for-processing-big-data . These pipelines can be configured to handle specific batch sizes depending on the volume and frequency of data transfer. The batch size should be chosen based on factors such as the expected data volume, the performance characteristics of the processing system, and the latency requirements of the analytics workload.
It is also important to consider the source of the data. For instance, OLTP systems are optimized for immediate transaction processing, while OLAP systems are designed for analytical processing of large sets of historical data https://learn.microsoft.com/en-us/training/modules/design-hybrid-transactional-analytical-processing-using-azure-synapse-analytics/2-understand-patterns . The data from OLTP systems is typically loaded into OLAP systems using ETL processes, which can be configured to process data in batches of a certain size.
Azure Stream Analytics is another tool that can be used to ingest real-time data into Azure Synapse Analytics https://learn.microsoft.com/en-us/training/modules/ingest-streaming-data-use-azure-stream-analytics-synapse/8-summary . When dealing with real-time data, the concept of batch size may differ, but the underlying principle of grouping data for processing remains the same.
For additional information on Azure Synapse Analytics and how to configure batch processing within this service, you can refer to the following resource: - Introduction to Azure Synapse Analytics https://learn.microsoft.com/en-us/training/modules/ingest-streaming-data-use-azure-stream-analytics-synapse/8-summary .
Remember to consider the specific needs of your data processing scenario when configuring batch sizes to ensure optimal performance and efficiency.
Please note that the URLs provided are for reference purposes and are part of the retrieved documents.
Develop data processing (40–45%)
Develop a batch processing solution
Create Tests for Data Pipelines
When designing data pipelines, it is crucial to implement testing strategies to ensure the reliability and accuracy of the data processing. Testing data pipelines involves verifying that each component of the pipeline functions as expected and that the data is transformed correctly as it moves through the pipeline stages. Below are key considerations and steps for creating tests for data pipelines:
Dataset and Linked Services: Begin by defining the datasets that will be consumed and produced by the activities in the pipeline. Each dataset should have a schema that defines the structure of the data and be associated with a linked service for source connection https://learn.microsoft.com/en-us/training/modules/build-data-pipeline-azure-synapse-analytics/2-understand-pipelines-azure-synapse-analytics .
Pipeline Creation and Management: Utilize Azure Synapse Studio to create and manage pipelines. The graphical design interface on the Integrate page allows for the visual arrangement of activities and the configuration of their settings https://learn.microsoft.com/en-us/training/modules/build-data-pipeline-azure-synapse-analytics/3-create-pipeline-azure-synapse-studio .
Activity Dependencies: Define the logical sequence of activities by connecting them with dependency conditions such as Succeeded, Failed, and Completed. These conditions help to manage the flow and error handling within the pipeline https://learn.microsoft.com/en-us/training/modules/build-data-pipeline-azure-synapse-analytics/3-create-pipeline-azure-synapse-studio .
External Processing Resources: Incorporate external resources like Apache Spark pools for specific tasks. This is particularly useful for big data analytics solutions where Spark notebooks are used for data transformation processes https://learn.microsoft.com/en-us/training/modules/use-spark-notebooks-azure-synapse-pipeline/2-understand-notebooks-pipelines .
Data Flow Activities: Use Data Flow activities to define the transformation logic. Data flows consist of sources, transformations, and sinks. Ensure that the data mappings for columns are correctly defined as the data flows through the stages https://learn.microsoft.com/en-us/training/modules/build-data-pipeline-azure-synapse-analytics/4-define-data-flows .
Testing Strategies:
- Unit Testing: Test individual components or activities within the pipeline to verify that each one performs its intended function correctly.
- Integration Testing: After unit testing, perform integration testing to ensure that the components work together as expected.
- End-to-End Testing: Simulate the complete execution of the pipeline to validate the end-to-end data flow and transformation logic.
- Performance Testing: Assess the pipeline’s performance, including its ability to handle the expected data volume and processing speed.
Debugging and Monitoring: Enable the Data flow debug option while developing data flows to test mappings and transformations with a subset of data. Use tools like Spark UI for monitoring and debugging to gain insights into the performance of data processing tasks https://learn.microsoft.com/en-us/training/modules/use-spark-notebooks-azure-synapse-pipeline/2-understand-notebooks-pipelines https://learn.microsoft.com/en-us/training/modules/build-data-pipeline-azure-synapse-analytics/4-define-data-flows .
Best Practices: Follow best practices such as organizing code, caching intermediate results, avoiding unnecessary computations, and keeping dependencies updated and consistent https://learn.microsoft.com/en-us/training/modules/use-spark-notebooks-azure-synapse-pipeline/2-understand-notebooks-pipelines .
For additional information on implementing data flow activities and best practices, refer to the Azure documentation on Data Flow activity in Azure Data Factory and Azure Synapse Analytics https://learn.microsoft.com/en-us/training/modules/build-data-pipeline-azure-synapse-analytics/4-define-data-flows .
By adhering to these guidelines and utilizing the available tools and resources, you can create robust tests for your data pipelines, ensuring that they are reliable, efficient, and ready for production use.
Develop data processing (40–45%)
Develop a batch processing solution
Integrate Jupyter or Python Notebooks into a Data Pipeline
Integrating Jupyter or Python notebooks into a data pipeline involves several steps and considerations to ensure that the notebooks function effectively within an automated workflow. Here’s a detailed explanation of how to achieve this integration, particularly within the Azure Synapse Analytics environment.
Understanding Notebooks in Azure Synapse Studio
Azure Synapse Studio provides an integrated notebook interface that supports working with Apache Spark. These notebooks are similar to Jupyter notebooks and are designed to be intuitive, allowing users to combine code with Markdown notes. They are commonly utilized by data scientists and data analysts for interactive data exploration and analysis https://learn.microsoft.com/en-us/training/modules/understand-big-data-engineering-with-apache-spark-azure-synapse-analytics/3-use-spark .
Key Features of Notebooks in Azure Synapse Studio:
- Syntax highlighting and error support for easier code writing and debugging.
- Code auto-completion to speed up coding.
- Interactive data visualizations for better data insights.
- Ability to export results for reporting or further analysis https://learn.microsoft.com/en-us/training/modules/understand-big-data-engineering-with-apache-spark-azure-synapse-analytics/3-use-spark .
Configuring Notebook Parameters
To define parameters within a notebook, variables are declared and initialized in a cell. This cell is then configured as a Parameters cell using the toggle option in the notebook editor interface. Initializing variables with default values ensures that they are used if the parameter isn’t explicitly set in the notebook activity https://learn.microsoft.com/en-us/training/modules/use-spark-notebooks-azure-synapse-pipeline/4-notebook-parameters .
Automating Notebooks in Data Pipelines
Azure Synapse Analytics pipelines allow for the orchestration of data transfer and transformation activities. The Synapse Notebook activity within a pipeline enables the running of data processing code in Spark notebooks as a task, automating big data processing tasks and integrating them into ETL (extract, transform, and load) workloads https://learn.microsoft.com/en-us/training/modules/use-spark-notebooks-azure-synapse-pipeline/1-introduction .
Creating and Configuring a Pipeline with Notebook Activity
To integrate a Spark notebook into an Azure Synapse Analytics pipeline:
- Create a pipeline that includes a notebook activity.
- Configure the parameters for the notebook to control its execution within the pipeline https://learn.microsoft.com/en-us/training/modules/use-spark-notebooks-azure-synapse-pipeline/5-exercise-use-spark-notebooks-pipeline .
Running Notebooks on Spark Pools
When a notebook is included in a pipeline, it is executed on a Spark pool within the Azure Synapse Analytics workspace. The Spark pool should be configured with the appropriate compute resources and Spark runtime to handle the specific workload. The pipeline itself is managed by an integration runtime that orchestrates the activities, coordinating the services needed to run them https://learn.microsoft.com/en-us/training/modules/use-spark-notebooks-azure-synapse-pipeline/2-understand-notebooks-pipelines .
Best Practices for Working with Spark Notebooks
- Keep code organized with clear and descriptive names.
- Cache intermediate results to improve performance.
- Avoid unnecessary computations to optimize processing.
- Use Spark UI for monitoring and debugging.
- Keep dependencies version-consistent and updated https://learn.microsoft.com/en-us/training/modules/use-spark-notebooks-azure-synapse-pipeline/2-understand-notebooks-pipelines .
For additional information on working with notebooks in Azure Synapse Analytics, refer to the following resources:
- Create, develop, and maintain Synapse notebooks in Azure Synapse Analytics https://learn.microsoft.com/en-us/training/modules/understand-big-data-engineering-with-apache-spark-azure-synapse-analytics/3-use-spark .
By following these guidelines and utilizing the features provided by Azure Synapse Studio, Jupyter or Python notebooks can be seamlessly integrated into data pipelines, enhancing the automation and efficiency of data processing tasks.
Develop data processing (40–45%)
Develop a batch processing solution
Upsert Data in Azure Data Lake Storage Gen2
Upsert is a combination of the words “update” and “insert.” In the context of data storage and management, upsert refers to the ability to insert new data if it does not already exist, or update existing data if it does. This operation is particularly useful in scenarios where data is ingested from multiple sources and needs to be synchronized without duplication.
Azure Data Lake Storage Gen2 is a highly scalable and secure data storage solution that supports big data analytics workloads https://learn.microsoft.com/en-us/training/modules/introduction-to-azure-data-lake-storage/8-summary . It is built on Azure Blob storage, providing enhancements specifically for analytics performance https://learn.microsoft.com/en-us/training/modules/introduction-to-azure-data-lake-storage/2-azure-data-lake-gen2 . When dealing with Azure Data Lake Storage Gen2, upsert operations can be crucial for maintaining the integrity and relevance of the data stored within the data lake.
To perform upsert operations in Azure Data Lake Storage Gen2, you would typically use Azure Synapse Analytics or Azure Databricks, which can interact with the data stored in Azure Data Lake Storage Gen2 https://learn.microsoft.com/en-us/training/modules/introduction-to-azure-data-lake-storage/8-summary . These services provide the compute power and tools necessary to process large volumes of data and can be configured to handle upserts efficiently.
When planning to implement upserts, it is important to consider the structure of your data, access patterns, and governance policies to ensure that the data lake remains organized and accessible, rather than turning into a “data swamp” https://learn.microsoft.com/en-us/training/modules/introduction-to-azure-data-lake-storage/2-azure-data-lake-gen2 . Proper planning and implementation of upsert operations can help maintain a clean and efficient data lake, enabling your organization to derive insights and make data-driven decisions.
For additional information on Azure Data Lake Storage Gen2 and its capabilities, you can refer to the following URL: Introduction to Azure Data Lake Storage Gen2 https://learn.microsoft.com/en-us/training/modules/introduction-to-azure-data-lake-storage/8-summary .
Please note that while the URL provided offers further details on Azure Data Lake Storage Gen2, it does not specifically address upsert operations. Upsert functionality would be more directly related to the compute services that interact with the data lake, such as Azure Synapse Analytics or Azure Databricks, rather than the storage solution itself.
Develop data processing (40–45%)
Develop a batch processing solution
Reverting Data to a Previous State
In the realm of data management and analytics, the ability to revert data to a previous state is a critical feature. This capability ensures that data can be restored to a known good state after unintended modifications or errors. Here’s a detailed explanation of how data can be reverted to a previous state in Azure Synapse Analytics and Delta Lake, which are part of the technologies covered by the DP-203 Data Engineering on Microsoft Azure certification.
Azure Synapse Analytics: Dedicated SQL Pools
Azure Synapse Analytics provides a dedicated SQL pool feature that allows for the creation of a relational data warehouse. This dedicated SQL pool can be paused when not in use to prevent unnecessary costs, and importantly, it can be restored to a previous state. When provisioning a dedicated SQL pool, you have the option to start with an empty pool or restore an existing database from a backup. This restoration process is crucial for reverting data to a previous state in case of data corruption or loss https://learn.microsoft.com/en-us/training/modules/design-multidimensional-schema-to-optimize-analytical-workloads/3-create-tables .
Delta Lake: Transactional Support
Delta Lake enhances Apache Spark with capabilities that allow for reverting data to a previous state. It achieves this by implementing a transaction log that records every change made to the data. This log provides a full history of the data modifications, enabling rollback to a previous version if necessary. Delta Lake’s transactional support ensures atomicity, consistency, isolation, and durability (ACID properties), which are essential for maintaining data integrity and enabling the reversion of data to a prior state in case of errors or issues https://learn.microsoft.com/en-us/training/modules/use-delta-lake-azure-synapse-analytics/2-understand-delta-lake .
Using SQL in Notebooks
In Azure Synapse Analytics, you can use the %%sql magic
command in a notebook to run SQL code that interacts with the data. This
capability is useful for querying data states at different points in
time, which can be helpful when assessing the need to revert data https://learn.microsoft.com/en-us/training/modules/understand-big-data-engineering-with-apache-spark-azure-synapse-analytics/4-write-spark-code
.
Dataframe Manipulations
Dataframes in Spark can be manipulated using various methods such as
select, where, and groupBy. These
methods allow for the transformation of dataframes, and by extension,
the data they contain. While not directly related to reverting data,
understanding these manipulations is essential for managing data states
and ensuring that the correct data is being operated on https://learn.microsoft.com/en-us/training/modules/understand-big-data-engineering-with-apache-spark-azure-synapse-analytics/4-write-spark-code
.
Serverless SQL Pools
Azure Synapse Analytics also offers serverless SQL pools that can
query data files in various formats like CSV, JSON, and Parquet. The
OPENROWSET function is used to generate a tabular rowset
from these files, which can be useful for querying data at different
states. This function can be particularly helpful when you need to
access historical data for comparison or reversion purposes https://learn.microsoft.com/en-us/training/modules/query-data-lake-using-azure-synapse-serverless-sql-pools/3-query-files
.
For more detailed information on the syntax and usage of the
OPENROWSET function, you can refer to the Azure Synapse
Analytics documentation: Azure
Synapse Analytics documentation https://learn.microsoft.com/en-us/training/modules/query-data-lake-using-azure-synapse-serverless-sql-pools/3-query-files
.
In summary, reverting data to a previous state is a multifaceted process that involves various features and capabilities within Azure Synapse Analytics and Delta Lake. Understanding how to provision, manage, and manipulate data within these services is essential for maintaining data integrity and ensuring that data can be restored to a desired state when necessary.
Develop data processing (40–45%)
Develop a batch processing solution
Configure Exception Handling
When designing data integration solutions, it’s crucial to implement robust exception handling to manage and respond to errors that may occur during the data processing lifecycle. Exception handling ensures that your data workflows are resilient and can recover gracefully from unexpected issues, thereby maintaining data integrity and system reliability.
In Azure Synapse Analytics, exception handling can be configured within pipelines. Pipelines are used to define and orchestrate data movement and transformation activities. They allow you to automate extract, transform, and load (ETL) workloads as part of an enterprise analytical solution https://learn.microsoft.com/en-us/training/modules/build-data-pipeline-azure-synapse-analytics/1-introduction .
Here are the steps to configure exception handling in Azure Synapse Analytics:
Use the Try-Catch Pattern: Implement a try-catch pattern in your pipeline design. This involves creating activities that may fail within a ‘try’ container, and then defining a ‘catch’ container that contains activities to perform if an error occurs https://learn.microsoft.com/en-us/training/modules/build-data-pipeline-azure-synapse-analytics/8-summary .
Activity Dependency Conditions: Set up dependency conditions between activities. Azure Synapse Analytics allows you to specify whether the next activity should run always, only on success, or only on failure of the previous activity. This can help in directing the flow of activities based on whether an exception has occurred https://learn.microsoft.com/en-us/training/modules/build-data-pipeline-azure-synapse-analytics/1-introduction .
Error Logging: Incorporate activities within the ‘catch’ section to log errors. This can be done by writing error details to an Azure SQL Database or a blob storage for later analysis. Logging is crucial for diagnosing issues and for auditing purposes .
Retry Policies: Define retry policies for transient failures. Azure Synapse Analytics allows you to specify the number of retries and the interval between retries for activities that may encounter transient issues, such as temporary network outages https://learn.microsoft.com/en-us/training/modules/build-data-pipeline-azure-synapse-analytics/1-introduction .
Monitoring and Alerts: Utilize Azure Synapse Analytics monitoring features to set up alerts. This can notify administrators or trigger automated processes when errors are detected in the pipelines https://learn.microsoft.com/en-us/training/modules/build-data-pipeline-azure-synapse-analytics/1-introduction .
Data Flow Debugging: When using Data Flow activities, enable the Data flow debug option to test the data flow with a subset of data. This can help identify and resolve mapping issues or other errors before full-scale processing https://learn.microsoft.com/en-us/training/modules/build-data-pipeline-azure-synapse-analytics/4-define-data-flows .
For more detailed guidance on implementing exception handling within Azure Synapse Analytics, refer to the following resources: - Iterative development and debugging with Azure Data Factory and Synapse Analytics pipelines https://learn.microsoft.com/en-us/training/modules/build-data-pipeline-azure-synapse-analytics/8-summary . - Data integration in Azure Synapse Analytics versus Azure Data Factory https://learn.microsoft.com/en-us/training/modules/build-data-pipeline-azure-synapse-analytics/1-introduction . - Data Flow activity in Azure Data Factory and Azure Synapse Analytics https://learn.microsoft.com/en-us/training/modules/build-data-pipeline-azure-synapse-analytics/4-define-data-flows .
By following these steps and utilizing the provided resources, you can effectively configure exception handling in your Azure Synapse Analytics solutions, ensuring that your data integration processes are robust and reliable.
Develop data processing (40–45%)
Develop a batch processing solution
Batch retention refers to the process of determining how long data should be kept in a system before it is deleted or archived. In the context of data processing and analytics, configuring batch retention is crucial for managing storage costs, ensuring compliance with data retention policies, and optimizing system performance.
When dealing with Azure services, batch retention can be configured in various ways depending on the specific service and the nature of the data. Here’s a detailed explanation of how to configure batch retention for Azure Cosmos DB and Azure Synapse Analytics, which are relevant to data engineering on Microsoft Azure:
Azure Cosmos DB Analytical Store
Azure Cosmos DB offers an analytical store that enables large-scale
analytics against operational data with no impact on transactional
workloads. To configure batch retention for the analytical store in
Azure Cosmos DB, you can use Azure PowerShell or Azure CLI to set the
-AnalyticalStorageTtl parameter, which determines the
time-to-live (TTL) for analytical data.
Azure PowerShell: Use the
New-AzCosmosDBSqlContainercmdlet to create a new container orUpdate-AzCosmosDBSqlContainerto configure an existing container with the-AnalyticalStorageTtlparameter. Setting this parameter to-1enables permanent retention of analytical data https://learn.microsoft.com/en-us/training/modules/configure-azure-synapse-link-with-azure-cosmos-db/3-create-analytical-store-enabled-container .New-AzCosmosDBSqlContainer -ResourceGroupName "my-rg" -AccountName "my-cosmos-db" -DatabaseName "my-db" -Name "my-container" -PartitionKeyKind "hash" -PartitionKeyPath "/productID" -AnalyticalStorageTtl -1Azure CLI: Use the
az cosmosdb sql container createcommand to create a new container oraz cosmosdb sql container updateto configure an existing container with the--analytical-storage-ttlparameter. Again, setting this parameter to-1enables permanent retention https://learn.microsoft.com/en-us/training/modules/configure-azure-synapse-link-with-azure-cosmos-db/3-create-analytical-store-enabled-container .az cosmosdb sql container create --resource-group my-rg --account-name my-cosmos-db --database-name my-db --name my-container --partition-key-path "/productID" --analytical-storage-ttl -1
For additional information on configuring Azure Cosmos DB, you can visit the official documentation: - Azure PowerShell: Azure Cosmos DB PowerShell - Azure CLI: Azure Cosmos DB CLI
Azure Synapse Analytics
Azure Synapse Analytics allows you to work with streaming data as well as batch data. While the retrieved documents do not provide specific commands for configuring batch retention in Azure Synapse Analytics, it is important to understand that data ingested can be combined with batch-processed data or synchronized from operational data sources using Azure Synapse Link https://learn.microsoft.com/en-us/training/modules/ingest-streaming-data-use-azure-stream-analytics-synapse/5-run-job-ingest .
For batch data movement, Azure Synapse Analytics or Azure Data Factory pipelines are typically used. The retention of this data would be configured within the settings of these pipelines or the data storage where the batch data is being kept.
For more information on Azure Synapse Analytics and data integration, you can refer to the following resources: - Azure Synapse Analytics: Azure Synapse Analytics Documentation - Azure Data Factory: Azure Data Factory Documentation
Please note that the URLs provided are for additional information and are not to be included in the study guide. The explanation above should be formatted and included in the study guide to help learners understand how to configure batch retention for Azure Cosmos DB and Azure Synapse Analytics.
Develop data processing (40–45%)
Develop a batch processing solution
Reading from and writing to a Delta Lake involves interacting with a storage layer that enhances Spark’s data processing capabilities. Delta Lake is an open-source storage layer that brings relational database features to Spark, allowing for batch and streaming data operations with transaction support and schema enforcement. This results in an analytical data store that combines the benefits of a relational database with the flexibility of a data lake https://learn.microsoft.com/en-us/training/modules/use-delta-lake-azure-synapse-analytics/1-introduction .
Reading from a Delta Lake
To read data from a Delta Lake, you can use the Spark SQL API or the DataFrame API. For instance, you can create a streaming DataFrame that reads from a Delta Lake table as new data is appended. Here’s an example using PySpark:
from pyspark.sql.types import *
from pyspark.sql.functions import *
# Load a streaming dataframe from the Delta Table
stream_df = spark.readStream.format("delta") \
.option("ignoreChanges", "true") \
.load("/delta/internetorders")
# Now you can process the streaming data in the dataframe
# for example, show it:
stream_df.writeStream \
.outputMode("append") \
.format("console") \
.start()This code snippet demonstrates how to read streaming data from a
Delta Lake table. It’s important to note that when using a Delta Lake
table as a streaming source, only append operations are supported unless
you specify options like ignoreChanges or
ignoreDeletes https://learn.microsoft.com/en-us/training/modules/use-delta-lake-azure-synapse-analytics/5-use-delta-lake-streaming-data
.
Writing to a Delta Lake
Writing to a Delta Lake involves using Spark’s DataFrame API to perform insert, update, and delete operations on the data stored in Delta Lake tables. Delta Lake tables support CRUD operations, allowing you to manipulate data similarly to how you would in a traditional relational database https://learn.microsoft.com/en-us/training/modules/use-delta-lake-azure-synapse-analytics/2-understand-delta-lake .
Here’s a simple example of writing data to a Delta Lake table:
# Assuming df is a Spark DataFrame containing the data to be written
df.write.format("delta").save("/delta/internetorders")This code snippet shows how to write data from a DataFrame to a Delta
Lake table, where /delta/internetorders is the path to the
Delta Lake table.
Querying Delta Lake Tables Using SQL
Additionally, you can use the serverless SQL pool in Azure Synapse
Analytics to query Delta Lake tables using SQL. This is particularly
useful for running queries for reporting and analysis on processed data.
The OPENROWSET function can be used to read delta format
data:
SELECT *
FROM OPENROWSET(
BULK 'https://mystore.dfs.core.windows.net/files/delta/mytable/',
FORMAT = 'DELTA'
) AS deltadataThis SQL query retrieves data from a Delta Lake table stored at the specified file location https://learn.microsoft.com/en-us/training/modules/use-delta-lake-azure-synapse-analytics/6-delta-with-sql .
For more detailed information on working with Delta Lake in Azure Synapse Analytics, you can refer to the following resources: - Delta Lake and Azure Synapse Analytics documentation - Using Delta Lake with Azure Synapse Analytics
Please note that the URLs provided are for additional information and are not to be included in the study guide.
Develop data processing (40–45%)
Develop a stream processing solution
Create a Stream Processing Solution by using Stream Analytics and Azure Event Hubs
Stream processing solutions enable real-time analytics on data as it flows from various sources. Azure Stream Analytics, in conjunction with Azure Event Hubs, provides a robust platform for building such solutions. Here’s a detailed explanation of how to create a stream processing solution using these services:
1. Ingest Data with Azure Event Hubs
Azure Event Hubs serves as the entry point for streaming data. It is a highly scalable data streaming platform and event ingestion service that can receive and process millions of events per second. Data sent to an Event Hub can be consumed by Azure Stream Analytics for processing.
- Azure Event Hubs: Acts as the input source for streaming data. It can handle large volumes of event data, making it suitable for event-driven architectures and big data scenarios https://learn.microsoft.com/en-us/training/modules/visualize-real-time-data-azure-stream-analytics-power-bi/2-power-bi-output .
2. Process Data with Azure Stream Analytics
Once the data is ingested through Azure Event Hubs, Azure Stream Analytics can be used to process and analyze the data in real-time.
- Azure Stream Analytics: A complex event processing service that enables you to ingest, process, and analyze streaming data. It uses a SQL-like query language to easily define stream processing logic https://learn.microsoft.com/en-us/training/modules/introduction-to-data-streaming/3-event-processing .
3. Define Stream Analytics Inputs
Configure Azure Stream Analytics to receive input from Azure Event Hubs. The data for each streamed event includes the event’s data fields and input-specific metadata fields, such as EventEnqueuedUtcTime, which indicates when the event was received in the event hub https://learn.microsoft.com/en-us/training/modules/visualize-real-time-data-azure-stream-analytics-power-bi/2-power-bi-output .
4. Write Stream Analytics Queries
Stream Analytics queries are written in a SQL-like language, allowing you to select, filter, and aggregate data. For example, you can write a query to filter events based on certain criteria and project the desired fields to the output https://learn.microsoft.com/en-us/training/modules/introduction-to-data-streaming/3-event-processing .
5. Configure Outputs for Processed Data
Define where the processed data should be sent. Azure Stream Analytics supports various outputs, such as Azure Data Lake, Azure SQL Database, and Power BI for real-time dashboards https://learn.microsoft.com/en-us/training/modules/introduction-to-data-streaming/3-event-processing .
6. Run and Monitor the Stream Analytics Job
Once the inputs, queries, and outputs are configured, start the Stream Analytics job. It will run continuously, processing new data as it arrives and writing results to the configured outputs. Azure Stream Analytics ensures exactly-once event processing and at-least-once event delivery, with built-in recovery and checkpointing https://learn.microsoft.com/en-us/training/modules/introduction-to-data-streaming/3-event-processing .
Additional Resources
For more information on configuring and using Azure Stream Analytics and Azure Event Hubs for stream processing solutions, refer to the following resources:
- Stream data as input into Stream Analytics https://learn.microsoft.com/en-us/training/modules/visualize-real-time-data-azure-stream-analytics-power-bi/2-power-bi-output .
- Introduction to Azure Stream Analytics https://learn.microsoft.com/en-us/training/modules/introduction-to-data-streaming/3-event-processing .
- Azure Stream Analytics Query Language https://learn.microsoft.com/en-us/training/modules/introduction-to-data-streaming/3-event-processing .
- Outputs from Azure Stream Analytics https://learn.microsoft.com/en-us/training/modules/introduction-to-data-streaming/3-event-processing .
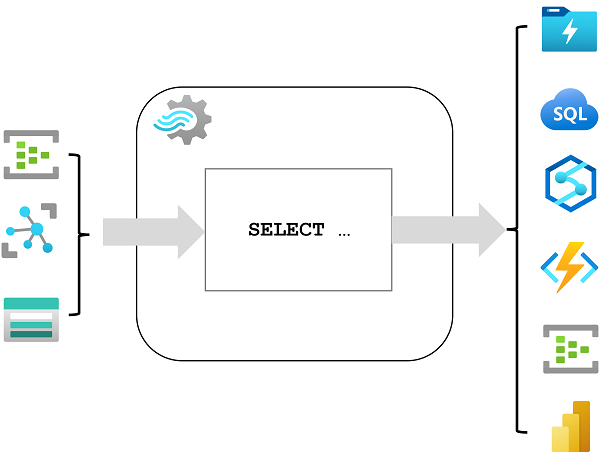
By following these steps and utilizing the provided resources, you can create a comprehensive stream processing solution that leverages the power of Azure Stream Analytics and Azure Event Hubs.
Develop data processing (40–45%)
Develop a stream processing solution
Processing Data with Spark Structured Streaming
Spark Structured Streaming is an advanced API provided by Apache Spark for handling streaming data. It allows for the continuous processing of live data streams in a fault-tolerant and scalable manner. The core concept behind Spark Structured Streaming is treating a live data stream as an unbounded table to which new data is continuously appended.
Understanding Spark Structured Streaming
Structured Streaming is built upon the Spark SQL engine, which means it uses a dataframe abstraction for streams of data. This approach provides a high-level API that can express complex transformations and analytical queries on streaming data, similar to batch processing, but with the added capability to handle real-time data.
Data Sources and Sinks
- Sources: Spark Structured Streaming can ingest data from various sources such as Kafka, Azure Event Hubs, network sockets, and file systems. It reads the streaming data and represents it as a dataframe for processing https://learn.microsoft.com/en-us/training/modules/use-delta-lake-azure-synapse-analytics/5-use-delta-lake-streaming-data .
- Sinks: After processing, the results can be written to different storage systems, known as sinks. These include file systems, databases, and live dashboards. Delta Lake tables can also be used as both sources and sinks for streaming data https://learn.microsoft.com/en-us/training/modules/use-delta-lake-azure-synapse-analytics/2-understand-delta-lake https://learn.microsoft.com/en-us/training/modules/use-delta-lake-azure-synapse-analytics/5-use-delta-lake-streaming-data .
Processing Data
Once the data is loaded into a dataframe, you can apply transformations and actions to process it. For example, you can select specific fields, aggregate data over time windows, or join streaming data with static data. The processed data can then be output to a sink for storage or further analysis.
Example of Using Delta Lake with Spark Structured Streaming
Here’s a PySpark example where a Delta Lake table is used to store streaming data:
from pyspark.sql.types import *
from pyspark.sql.functions import *
# Load a streaming dataframe from the Delta Table
stream_df = spark.readStream.format("delta") \
.option("ignoreChanges", "true") \
.load("/delta/internetorders")
# Process the streaming data in the dataframe
# For example, display it:
stream_df.writeStream \
.outputMode("append") \
.format("console") \
.start()In this example, the streaming dataframe is loaded from a Delta Lake
table and displayed in the console. Note that when using Delta Lake as a
streaming source, you should handle only append operations unless you
specify options like ignoreChanges or
ignoreDeletes to avoid errors https://learn.microsoft.com/en-us/training/modules/use-delta-lake-azure-synapse-analytics/5-use-delta-lake-streaming-data
.
Additional Resources
For more detailed information and a comprehensive guide on Spark Structured Streaming, you can refer to the official Structured Streaming Programming Guide provided by Apache Spark https://learn.microsoft.com/en-us/training/modules/use-delta-lake-azure-synapse-analytics/5-use-delta-lake-streaming-data .
By understanding and utilizing Spark Structured Streaming, you can effectively process and analyze real-time data, enabling the development of sophisticated streaming applications that can react quickly to new information.
Develop data processing (40–45%)
Develop a stream processing solution
Create Windowed Aggregates
Windowed aggregates are a crucial concept in stream processing, where data is continuously generated and needs to be analyzed in real-time or near real-time. These aggregates are used to perform calculations across a set of rows that are related to the current row within a specified range. This is particularly useful for analyzing temporal data, which is common in scenarios involving Internet-of-Things (IoT) devices, social media platforms, and other applications that generate streaming data.
Understanding Window Functions
To create windowed aggregates, you can use window functions in your SQL queries. These functions allow you to define the type of window you want to use, such as:
- Tumbling Windows: These are fixed-sized, non-overlapping, and contiguous intervals of time. They are useful for capturing metrics over regular intervals.
- Hopping Windows: These windows have a fixed size but can overlap with each other. They are defined by their size and the hop interval.
- Sliding Windows: These windows are defined by a period of activity. A new window is created every time an event occurs and includes all events that happened within a defined period before the event.
Example of a Windowed Aggregate Query
Here is an example of a SQL query that groups streaming sensor readings into 1-minute tumbling windows, recording the start and end time of each window and the maximum reading for each sensor:
SELECT
DateAdd(second, -60, System.TimeStamp) AS StartTime,
System.TimeStamp AS EndTime,
SensorID,
MAX(ReadingValue) AS MaxReading
INTO [synapse-output]
FROM [streaming-input]
TIMESTAMP BY EventEnqueuedUtcTime
GROUP BY SensorID, TumblingWindow(second, 60)
HAVING COUNT(*) >= 1In this example, the GROUP BY clause includes a tumbling
window function that groups the data into 1-minute intervals. The
HAVING clause is used to filter the results to include only
windows where at least one event occurred https://learn.microsoft.com/en-us/training/modules/ingest-streaming-data-use-azure-stream-analytics-synapse/4-define-query
.
Tools for Windowed Aggregates
Azure Stream Analytics is a powerful service that enables you to create jobs that query and aggregate event data as it arrives. You can write the results into an output sink, such as Azure Data Lake Storage Gen2, for further analysis and visualization https://learn.microsoft.com/en-us/training/modules/introduction-to-azure-data-lake-storage/6-use-cases .
For more information about window functions and common patterns for streaming queries, you can refer to the following resources:
- Introduction to Stream Analytics windowing functions https://learn.microsoft.com/en-us/training/modules/ingest-streaming-data-use-azure-stream-analytics-synapse/4-define-query .
- Common query patterns in Azure Stream Analytics https://learn.microsoft.com/en-us/training/modules/ingest-streaming-data-use-azure-stream-analytics-synapse/4-define-query .
By understanding and utilizing windowed aggregates, you can effectively process and analyze streaming data to gain real-time insights into your data streams.
Develop data processing (40–45%)
Develop a stream processing solution
Schema drift refers to the changes that occur in the structure of data over time, such as when new columns are added or existing ones are modified or deleted. Handling schema drift is crucial in data management systems to ensure that data processing pipelines continue to function correctly despite changes in data schema.
In Azure Synapse Analytics, handling schema drift can be managed effectively through the use of lake databases. Lake databases allow for a flexible schema that is decoupled from the file-based storage, enabling data analysts and engineers to benefit from the structured schema of relational databases while maintaining the flexibility of storing data files in a data lake https://learn.microsoft.com/en-us/training/modules/create-metadata-objects-azure-synapse-serverless-sql-pools/1-introduction .
To handle schema drift in Azure Synapse Analytics, you can:
Understand Lake Database Concepts and Components: Familiarize yourself with the components of lake databases, such as tables, views, and relationships, and how they relate to file-based storage in a data lake https://learn.microsoft.com/en-us/training/modules/create-metadata-objects-azure-synapse-serverless-sql-pools/1-introduction .
Create a Lake Database: Set up a lake database in Azure Synapse Analytics to manage your data schema. This allows you to define an explicit relational schema that can evolve as the underlying data changes https://learn.microsoft.com/en-us/training/modules/create-metadata-objects-azure-synapse-serverless-sql-pools/1-introduction .
Use Data Lake Storage Gen2: Implement Azure Data Lake Storage Gen2, which is designed to handle a large variety of data at scale and supports schema evolution, making it suitable for both real-time and batch processing solutions https://learn.microsoft.com/en-us/training/modules/introduction-to-azure-data-lake-storage/2-azure-data-lake-gen2 .
Combine Streaming and Batch Data: Work with streaming data in Azure Synapse Analytics as you would with batch-processed data. This integration allows for a unified approach to data management, accommodating schema changes across different data ingestion methods https://learn.microsoft.com/en-us/training/modules/ingest-streaming-data-use-azure-stream-analytics-synapse/5-run-job-ingest .
For additional information on handling schema drift and working with lake databases in Azure Synapse Analytics, you can refer to the following resources:
- Lake databases in Azure Synapse Analytics
- Azure Data Lake Storage Gen2 Overview
- Azure Synapse Analytics Documentation
Please note that the URLs provided are for reference purposes to supplement the study guide and are not meant to be included as part of the exam content.
Develop data processing (40–45%)
Develop a stream processing solution
Processing Time Series Data
Time series data refers to a sequence of data points collected or recorded at time-ordered intervals. This type of data is prevalent in various domains, such as finance, weather monitoring, and Internet of Things (IoT) applications. Processing time series data involves capturing, analyzing, and storing these data points to uncover trends, patterns, and insights over time.
Capturing Time Series Data
Time series data is often generated continuously by sensors or user activities. For instance, IoT devices may emit readings at regular intervals, or social media platforms may generate user interaction data. To handle this perpetual stream of information, technologies like Azure Event Hubs can be employed to capture streaming events in a queue for processing https://learn.microsoft.com/en-us/training/modules/introduction-to-azure-data-lake-storage/6-use-cases .
Analyzing Time Series Data
Once captured, the data needs to be processed and analyzed. Azure Stream Analytics is a service that enables the creation of jobs to query and aggregate event data as it arrives. This real-time processing can involve counting occurrences, calculating averages, or performing more complex analyses like sentiment analysis on social media messages https://learn.microsoft.com/en-us/training/modules/introduction-to-data-streaming/2-data-streams https://learn.microsoft.com/en-us/training/modules/introduction-to-azure-data-lake-storage/6-use-cases .
Storing Time Series Data
After analysis, the results need to be stored for further use or visualization. Azure Data Lake Storage Gen2 is an example of a storage solution that organizes data into a hierarchical file system, allowing for efficient data processing and reduced computational resources https://learn.microsoft.com/en-us/training/modules/introduction-to-azure-data-lake-storage/2-azure-data-lake-gen2 . This storage solution can act as an output sink for the processed data, enabling subsequent analysis and visualization https://learn.microsoft.com/en-us/training/modules/introduction-to-azure-data-lake-storage/6-use-cases .
Real-Time Analytics
Real-time analytics is crucial for time series data as it allows organizations to react promptly to trends or issues identified in the data stream. Azure Synapse Link for SQL, for example, provides a hybrid transactional/analytical processing (HTAP) capability that synchronizes transactional data with a dedicated SQL pool in Azure Synapse Analytics for near real-time analytical workloads https://learn.microsoft.com/en-us/training/modules/implement-synapse-link-for-sql/1-introduction .
Additional Resources
For more information on processing time series data and the technologies mentioned, you can visit the following URLs:
- Azure Event Hubs: Azure Event Hubs documentation
- Azure Stream Analytics: Azure Stream Analytics documentation
- Azure Data Lake Storage Gen2: Azure Data Lake Storage Gen2 documentation
- Azure Synapse Link for SQL: Azure Synapse Link for SQL documentation
By understanding and utilizing these Azure services, you can effectively process time series data to gain actionable insights and drive informed decision-making.
Develop data processing (40–45%)
Develop a stream processing solution
Process Data Across Partitions
Partitioning is a critical concept in data processing that involves dividing a dataset into smaller, more manageable parts, which can be processed independently and in parallel. This technique is particularly useful in distributed computing environments, such as Apache Spark, where it can significantly enhance performance by optimizing resource utilization across worker nodes https://learn.microsoft.com/en-us/training/modules/transform-data-spark-azure-synapse-analytics/3-partition-data .
Understanding Data Partitioning
In a data lake, data is often partitioned by placing it across multiple files in subfolders that reflect partitioning criteria. This structure allows distributed processing systems to execute operations in parallel on different data partitions or to skip reading certain partitions entirely when they are not needed for a query https://learn.microsoft.com/en-us/training/modules/query-data-lake-using-azure-synapse-serverless-sql-pools/3-query-files .
For instance, consider a scenario where you have a dataset of sales orders that you frequently need to filter by date, such as year and month. You could organize the data into a folder hierarchy like this:
/orders
/year=2020
/month=1
/01012020.parquet
/02012020.parquet
...
/month=2
/01022020.parquet
/02022020.parquet
...
/year=2021
/month=1
/01012021.parquet
/02012021.parquet
...To query only the orders from January and February 2020, you could use a query that filters results based on the folder structure, as shown in the following example:
SELECT *
FROM OPENROWSET(
BULK 'https://mydatalake.blob.core.windows.net/data/orders/year=*/month=*/*.*',
FORMAT = 'parquet'
) AS orders
WHERE orders.filepath(1) = '2020' AND orders.filepath(2) IN ('1','2');In this query, the filepath parameters correspond to the
wildcard positions in the folder names, allowing the query to target
specific partitions https://learn.microsoft.com/en-us/training/modules/query-data-lake-using-azure-synapse-serverless-sql-pools/3-query-files
.
Writing Partitioned Data
When saving a DataFrame as a set of partitioned files, you can use
the partitionBy method in Apache Spark. This method allows
you to specify one or more columns to partition the data by. The
resulting folder structure will include the partitioning column name and
value in a column=value format https://learn.microsoft.com/en-us/training/modules/transform-data-spark-azure-synapse-analytics/3-partition-data
.
Here’s an example of how to partition data by year when writing it to storage:
from pyspark.sql.functions import year, col

# Load source data
df = spark.read.csv('/orders/*.csv', header=True, inferSchema=True)

# Add Year column
dated_df = df.withColumn("Year", year(col("OrderDate")))

# Partition by year
dated_df.write.partitionBy("Year").mode("overwrite").parquet("/data")This code will create a folder for each year, containing the corresponding data files https://learn.microsoft.com/en-us/training/modules/transform-data-spark-azure-synapse-analytics/3-partition-data .
Reading Partitioned Data
When reading data from partitioned files into a DataFrame, you can directly access the data from any folder within the hierarchical structure. This allows you to filter the data at the storage level, reducing the amount of data that needs to be loaded and processed https://learn.microsoft.com/en-us/training/modules/transform-data-spark-azure-synapse-analytics/3-partition-data .
For example, to read only the sales orders from the year 2020:
orders_2020 = spark.read.parquet('/partitioned_data/Year=2020')
display(orders_2020.limit(5))This code will load only the data from the specified year, excluding the partitioning column from the resulting DataFrame https://learn.microsoft.com/en-us/training/modules/transform-data-spark-azure-synapse-analytics/3-partition-data .
Datasets in Azure Synapse Analytics
In Azure Synapse Analytics, datasets define the schema for each data object that will be used in a pipeline. They are associated with a linked service that connects to the data source. Datasets can be used as inputs or outputs for activities within a pipeline, and they are defined at the workspace level, allowing them to be shared across multiple pipelines https://learn.microsoft.com/en-us/training/modules/build-data-pipeline-azure-synapse-analytics/2-understand-pipelines-azure-synapse-analytics .
For more information on partitioning and processing data across partitions, you can refer to the following resources:
Partitioning is a powerful technique that can greatly improve the efficiency of data processing tasks, making it an essential concept for data professionals to understand and utilize effectively.
Develop data processing (40–45%)
Develop a stream processing solution
Processing within One Partition
When working with large datasets, particularly in big data scenarios, it’s common to partition data to improve performance and manageability. Partitioning involves dividing a dataset into multiple parts based on the values of one or more columns. Each partition can then be processed independently, which can lead to more efficient data processing, especially when dealing with distributed systems like Azure Synapse Analytics.
Understanding Partitions
Partitions are essentially subsets of your data that are stored separately. By partitioning data, you can:
- Improve Query Performance: Queries that filter data based on the partition key can read only the relevant partitions, reducing the amount of data that needs to be scanned.
- Optimize Data Management: Partitions allow for easier data management tasks such as data loading, archiving, and purging.
Processing Data within a Single Partition
When processing data within a single partition, the system can take advantage of the fact that all the data resides in a contiguous storage space. This can lead to more efficient processing because:
- Data Locality: Operations on the data can be performed where the data is located, reducing data movement and the associated overhead.
- Parallel Processing: If the dataset is partitioned across multiple nodes, each node can process its own partition in parallel with others, speeding up the overall processing time.
Example of Partition Processing
Consider a scenario where you have a dataset of sales orders, and you’ve partitioned this data by year. If you want to process orders from a specific year, you can directly access the partition corresponding to that year, bypassing all other data. This targeted approach to data processing is faster and more efficient.
Here’s a code snippet that demonstrates how to save a dataframe as a
partitioned set of files using the partitionBy method in
PySpark:
from pyspark.sql.functions import year, col

# Load source data
df = spark.read.csv('/orders/*.csv', header=True, inferSchema=True)

# Add Year column
dated_df = df.withColumn("Year", year(col("OrderDate")))

# Partition by year
dated_df.write.partitionBy("Year").mode("overwrite").parquet("/data")In this example, the data is partitioned by the “Year” column, and
each partition is stored in a separate folder named in a
column=value format https://learn.microsoft.com/en-us/training/modules/transform-data-spark-azure-synapse-analytics/3-partition-data
.
Reading from a Single Partition
To read data from a single partition, you can specify the partition in the file path. For instance, to read orders from the year 2020:
orders_2020 = spark.read.parquet('/partitioned_data/Year=2020')
display(orders_2020.limit(5))
This code will only read data from the 2020 partition, making the operation more efficient https://learn.microsoft.com/en-us/training/modules/transform-data-spark-azure-synapse-analytics/3-partition-data .
Additional Resources
For more information on partitioning and processing data with Azure Synapse Analytics, you can refer to the following resources:
Partitioning is a key concept in data processing and understanding how to effectively process data within a single partition is crucial for optimizing big data workloads.
Develop data processing (40–45%)
Develop a stream processing solution
Configure Checkpoints and Watermarking during Processing
When processing data streams, it is crucial to manage state and ensure data consistency, especially in the event of failures or reprocessing. This is where checkpoints and watermarking come into play.
Checkpoints are a feature that allows a processing system to maintain a record of the progress made in processing the data stream. By regularly recording the state of the system, checkpoints enable the process to resume from the last recorded state in case of a failure, rather than starting over from the beginning. This ensures fault tolerance and helps in maintaining exactly-once processing semantics.
Watermarking, on the other hand, is a technique used to handle event time processing in data streams. In streaming data, events can arrive out of order, and watermarking helps the system to manage this by providing a way to specify a threshold of lateness for events. Events that arrive after the watermark are considered late and can be handled accordingly, such as being ignored or processed in a special manner.
In Azure Synapse Analytics, you can configure checkpoints and watermarking as part of your stream processing activities. This is particularly relevant when using Apache Spark pools within Azure Synapse Analytics to process data from a data lake https://learn.microsoft.com/en-us/training/modules/understand-big-data-engineering-with-apache-spark-azure-synapse-analytics/1-introduction .
For more detailed information on how to configure checkpoints and watermarking in Azure Synapse Analytics, you can refer to the official documentation provided by Microsoft:
- For Apache Spark in Azure Synapse Analytics: Apache Spark in Azure Synapse Analytics
- For Azure Data Lake Storage and its integration with big data services: Introduction to Azure Data Lake Storage
Remember, while configuring checkpoints and watermarking, it is important to understand the characteristics of your data and the requirements of your processing tasks to set appropriate intervals and thresholds for these features.
Develop data processing (40–45%)
Develop a stream processing solution
Scale Resources
In the realm of data analytics, the ability to scale resources effectively is crucial for managing workloads and ensuring optimal performance. Azure Synapse Analytics is a service that exemplifies this capability by integrating a variety of technologies to process and analyze data at scale. It leverages SQL, an industry-standard language, for querying and manipulating large datasets https://learn.microsoft.com/en-us/training/modules/query-data-lake-using-azure-synapse-serverless-sql-pools/2-understand-serverless-pools .
Azure Synapse Analytics supports Apache Spark pools, which are essential for big data analytics. Spark pools allow users to perform big data processing alongside large-scale data warehousing operations. This integration facilitates a seamless workflow where data can be ingested, processed, and analyzed within the same environment https://learn.microsoft.com/en-us/training/modules/understand-big-data-engineering-with-apache-spark-azure-synapse-analytics/8-summary https://learn.microsoft.com/en-us/training/modules/understand-big-data-engineering-with-apache-spark-azure-synapse-analytics/1-introduction .
Scaling resources in Azure Synapse Analytics can be achieved by configuring Spark pools. These pools are resizable and can be adjusted to meet the computational demands of the workload. Users can run code in Spark notebooks to load, analyze, and visualize data, taking advantage of the dynamic scalability of Spark pools https://learn.microsoft.com/en-us/training/modules/understand-big-data-engineering-with-apache-spark-azure-synapse-analytics/8-summary https://learn.microsoft.com/en-us/training/modules/understand-big-data-engineering-with-apache-spark-azure-synapse-analytics/1-introduction .
Additionally, Azure Synapse Link for Azure Cosmos DB provides hybrid transactional and analytical processing (HTAP) capabilities. This feature enables real-time analytics on operational data in Azure Cosmos DB by linking it with Azure Synapse Analytics runtimes for Spark and SQL, thus offering another layer of scalability for diverse data workloads https://learn.microsoft.com/en-us/training/modules/configure-azure-synapse-link-with-azure-cosmos-db/5-create-resources .
For data storage, Azure Data Lake Storage is designed with scalability in mind. It uses Azure Blob replication models like locally redundant storage (LRS) and geo-redundant storage (GRS) to ensure data availability and protection. When planning a data lake, considerations such as data types, transformation processes, access control, and typical access patterns are vital. These factors influence the structure and organization of the data lake, which in turn affects its scalability https://learn.microsoft.com/en-us/training/modules/introduction-to-azure-data-lake-storage/2-azure-data-lake-gen2 .
For more information on scaling resources within Azure Synapse Analytics and related services, you can refer to the following resources: - Azure Synapse Analytics documentation - Apache Spark in Azure Synapse Analytics - Azure Synapse Link for Azure Cosmos DB - Azure Data Lake Storage
Please note that the URLs provided are for additional information and are not meant to be included in the study guide as direct references to the exam.
Develop data processing (40–45%)
Develop a stream processing solution
Create Tests for Data Pipelines
When designing data pipelines, it is crucial to implement testing strategies to ensure the reliability and accuracy of the data processing. Testing data pipelines involves verifying that each component of the pipeline functions as expected and that the data is transformed correctly throughout the process. Below are key considerations and steps for creating tests for data pipelines:
Define Test Datasets
- Datasets: Begin by defining datasets that represent the schema of the data objects used in the pipeline. These datasets should include a variety of test cases, including edge cases, to ensure comprehensive testing https://learn.microsoft.com/en-us/training/modules/build-data-pipeline-azure-synapse-analytics/2-understand-pipelines-azure-synapse-analytics .
Utilize Linked Services
- Linked Services: Ensure that the datasets are associated with linked services that connect to their respective data sources. This allows for the simulation of data flow from source to destination during testing https://learn.microsoft.com/en-us/training/modules/build-data-pipeline-azure-synapse-analytics/2-understand-pipelines-azure-synapse-analytics .
Test Data Integration Activities
- Azure Synapse Pipelines: Utilize Azure Synapse Pipelines to create, run, and manage data integration tests. These pipelines can orchestrate a series of data flow activities, which should be tested individually and as part of the overall workflow https://learn.microsoft.com/en-us/training/modules/use-spark-notebooks-azure-synapse-pipeline/2-understand-notebooks-pipelines .
External Processing Resources
- Apache Spark Pools: For specific tasks, consider using external processing resources like Apache Spark pools. Test the code in Spark notebooks to ensure that data transformation logic is correct before including it in the pipeline https://learn.microsoft.com/en-us/training/modules/use-spark-notebooks-azure-synapse-pipeline/2-understand-notebooks-pipelines .
Monitor and Debug
- Spark UI: Use the Spark UI to monitor and debug the performance of data processing tasks within the pipeline. This tool provides insights into task execution times, data sizes, and other performance metrics https://learn.microsoft.com/en-us/training/modules/use-spark-notebooks-azure-synapse-pipeline/2-understand-notebooks-pipelines .
Best Practices
- Code Organization: Keep the code organized with clear and descriptive names, and structure it into small, reusable chunks for easier testing and maintenance https://learn.microsoft.com/en-us/training/modules/use-spark-notebooks-azure-synapse-pipeline/2-understand-notebooks-pipelines .
- Caching: Cache intermediate results in Spark to improve the performance of the pipeline during testing https://learn.microsoft.com/en-us/training/modules/use-spark-notebooks-azure-synapse-pipeline/2-understand-notebooks-pipelines .
- Avoid Unnecessary Computations: Minimize unnecessary computations to streamline testing and optimize pipeline performance https://learn.microsoft.com/en-us/training/modules/use-spark-notebooks-azure-synapse-pipeline/2-understand-notebooks-pipelines .
Pipeline Orchestration
- ETL Workloads: Automate extract, transform, and load (ETL) workloads as part of the testing process to validate the regular operation of the pipeline https://learn.microsoft.com/en-us/training/modules/build-data-pipeline-azure-synapse-analytics/1-introduction .
Synapse Notebook Activity
- Synapse Notebook: Incorporate the Synapse Notebook activity into the pipeline to automate big data processing tests. This ensures that the data processing code in Spark notebooks is executed correctly within the ETL workflow https://learn.microsoft.com/en-us/training/modules/use-spark-notebooks-azure-synapse-pipeline/1-introduction .
Graphical Design Interface
- Pipeline Designer: Use the graphical design interface in Azure Synapse Studio to create and manage pipeline tests. The designer allows for the visual arrangement of activities and the configuration of their settings https://learn.microsoft.com/en-us/training/modules/build-data-pipeline-azure-synapse-analytics/3-create-pipeline-azure-synapse-studio .
Define Logical Sequence
- Activity Dependencies: Define the logical sequence of activities in the pipeline using dependency conditions like Succeeded, Failed, and Completed. This helps in testing the flow control and error handling within the pipeline https://learn.microsoft.com/en-us/training/modules/build-data-pipeline-azure-synapse-analytics/3-create-pipeline-azure-synapse-studio .
For additional information on creating and managing data pipelines in Azure Synapse Analytics, you can refer to the following resources: - Azure Synapse Analytics pipelines https://learn.microsoft.com/en-us/training/modules/build-data-pipeline-azure-synapse-analytics/1-introduction . - Use Spark notebooks in an Azure Synapse Pipeline https://learn.microsoft.com/en-us/training/modules/use-spark-notebooks-azure-synapse-pipeline/2-understand-notebooks-pipelines . - Build a data pipeline in Azure Synapse Analytics https://learn.microsoft.com/en-us/training/modules/build-data-pipeline-azure-synapse-analytics/3-create-pipeline-azure-synapse-studio .
By following these guidelines and utilizing the provided resources, you can create effective tests for data pipelines, ensuring that your data integration solutions are robust, reliable, and ready for production.
Develop data processing (40–45%)
Develop a stream processing solution
Optimize Pipelines for Analytical or Transactional Purposes
When optimizing pipelines, it’s important to understand the distinction between analytical and transactional systems and tailor the pipeline design accordingly.
Transactional Systems (OLTP)
Transactional systems, also known as Online Transaction Processing (OLTP) systems, are optimized for handling a high volume of short, atomic transactions. These systems are designed to respond quickly to user requests and manage operational data effectively. To optimize pipelines for OLTP systems, consider the following:
- Efficiency in Transaction Handling: Ensure that the pipeline can process discrete system or user requests rapidly and maintain data integrity.
- Concurrency and Availability: Design the pipeline to handle multiple concurrent transactions without performance degradation.
- Data Freshness: Since OLTP systems often require real-time or near-real-time data, pipelines should minimize latency in data processing and transfer.
Analytical Systems (OLAP)
On the other hand, analytical systems, known as Online Analytical Processing (OLAP) systems, are designed for complex queries and analyses of large sets of historical data. To optimize pipelines for OLAP systems, you should focus on:
- Data Throughput: OLAP systems deal with large volumes of data. Pipelines should be capable of high-throughput data ingestion and processing.
- Batch Processing: Since OLAP systems often work with historical data, pipelines can be optimized for batch processing using ETL (Extract, Transform, and Load) to move data from OLTP systems to OLAP systems https://learn.microsoft.com/en-us/training/modules/design-hybrid-transactional-analytical-processing-using-azure-synapse-analytics/2-understand-patterns .
- Scalability: Ensure that the pipeline can scale to handle the analytical workload, which may involve significant computational resources.
Azure Synapse Analytics Pipelines
Azure Synapse Analytics provides tools to build and optimize pipelines for both transactional and analytical purposes:
- Datasets and Linked Services: Define datasets to manage the schema of data objects and use linked services to connect to data sources. This helps in managing the data flow efficiently within the pipeline https://learn.microsoft.com/en-us/training/modules/build-data-pipeline-azure-synapse-analytics/2-understand-pipelines-azure-synapse-analytics .
- Synapse Notebook Activity: Utilize the Synapse Notebook activity to run Spark notebooks for big data processing tasks, which can be integrated into ETL workloads for analytical purposes https://learn.microsoft.com/en-us/training/modules/use-spark-notebooks-azure-synapse-pipeline/1-introduction .
- Automation and Orchestration: Automate and orchestrate data movement and transformation activities to ensure that the data is processed and available when needed https://learn.microsoft.com/en-us/training/modules/build-data-pipeline-azure-synapse-analytics/1-introduction .
- Monitoring and Troubleshooting: Use the monitoring features in Azure Synapse Studio to track pipeline runs and troubleshoot any issues that arise. This is crucial for maintaining the reliability of both transactional and analytical pipelines https://learn.microsoft.com/en-us/training/modules/build-data-pipeline-azure-synapse-analytics/5-run-pipelines .
For additional information on optimizing pipelines in Azure Synapse Analytics, refer to the following resources: - Data integration in Azure Synapse Analytics versus Azure Data Factory https://learn.microsoft.com/en-us/training/modules/build-data-pipeline-azure-synapse-analytics/1-introduction . - Integrate Microsoft Purview and Azure Synapse Analytics https://learn.microsoft.com/en-us/training/modules/build-data-pipeline-azure-synapse-analytics/5-run-pipelines .
By understanding the unique requirements of OLTP and OLAP systems and leveraging the capabilities of Azure Synapse Analytics, you can optimize pipelines to support both transactional and analytical workloads effectively.
Develop data processing (40–45%)
Develop a stream processing solution
Handling Interruptions in Data Solutions
When designing and implementing data solutions, it is crucial to account for interruptions that may occur during data processing. Interruptions can stem from various sources such as system failures, network issues, or unexpected data anomalies. To ensure data integrity and maintain smooth operation, several strategies can be employed:
- Fault Tolerance and Recovery:
- Implement fault-tolerant storage solutions, such as Azure Data Lake Storage, which is designed to handle large volumes of data and maintain high throughput even in the face of interruptions https://learn.microsoft.com/en-us/training/modules/introduction-to-azure-data-lake-storage/2-azure-data-lake-gen2 .
- Use Azure Synapse Analytics pipelines, which allow for the orchestration of data movement and processing tasks. These pipelines can be configured to handle failures and rerun activities as needed https://learn.microsoft.com/en-us/training/modules/build-data-pipeline-azure-synapse-analytics/2-understand-pipelines-azure-synapse-analytics .
- Data Organization:
- Organize data into a hierarchical structure of directories and subdirectories in Azure Data Lake Storage to facilitate easier navigation and more efficient data processing, which can help mitigate the impact of interruptions https://learn.microsoft.com/en-us/training/modules/introduction-to-azure-data-lake-storage/2-azure-data-lake-gen2 .
- Data Distribution Strategies:
- Choose appropriate data distribution options in Azure Synapse Analytics to optimize query performance and reduce the likelihood of interruptions. For example, use replicated distribution for smaller dimension tables and hash distribution for larger fact tables https://learn.microsoft.com/en-us/training/modules/design-multidimensional-schema-to-optimize-analytical-workloads/3-create-tables .
- Lake Database Design:
- Create a lake database in Azure Synapse Analytics and define tables with relationships that adhere to proven data modeling principles. This approach helps in managing data dependencies and recovery in case of interruptions https://learn.microsoft.com/en-us/training/modules/create-metadata-objects-azure-synapse-serverless-sql-pools/2-lake-database .
- Graphical Design Tools:
- Utilize the graphical design tools in Azure Synapse Studio to build complex pipelines that can include control flow activities for managing interruptions, such as branching and looping https://learn.microsoft.com/en-us/training/modules/build-data-pipeline-azure-synapse-analytics/2-understand-pipelines-azure-synapse-analytics .
For more information on designing distributed tables and handling interruptions in Azure Synapse Analytics, you can refer to the following resource: - Guidance for designing distributed tables using dedicated SQL pool in Azure Synapse Analytics https://learn.microsoft.com/en-us/training/modules/design-multidimensional-schema-to-optimize-analytical-workloads/3-create-tables .
By incorporating these strategies into your data solution design, you can create robust systems that are better equipped to handle interruptions and ensure continuous operation.
Develop data processing (40–45%)
Develop a stream processing solution
Configure Exception Handling in Data Integration Processes
Exception handling is a critical aspect of data integration processes, ensuring that the system can gracefully handle errors and anomalies without causing disruptions to the overall workflow. In the context of Azure Synapse Analytics and Azure Data Factory, exception handling can be implemented within pipelines to manage and orchestrate data movement activities effectively.
Implementing Exception Handling in Pipelines
When configuring exception handling in Azure Synapse Analytics pipelines, you can use activities like the “Lookup”, “If Condition”, and “Until” to perform error detection and control the flow based on the presence of exceptions. Additionally, the “Try-Catch” pattern can be implemented using these activities to manage errors:
Lookup Activity: Use this activity to retrieve a dataset or a value that can be used to determine if an exception has occurred. If the lookup fails, it can be an indication of an exception that needs to be handled https://learn.microsoft.com/en-us/training/modules/build-data-pipeline-azure-synapse-analytics/1-introduction .
If Condition Activity: This activity can evaluate expressions based on the output of previous activities, such as a Lookup. If an error condition is met, the “If True” activities can include custom error handling logic, while the “If False” branch can continue the normal execution flow .
Until Activity: This activity allows you to perform retries or wait for a certain condition to be met before proceeding. It can be useful in scenarios where transient errors are expected and can be resolved by simply retrying the operation after a delay .
Error Handling in Activities: Many activities in Azure Synapse Analytics pipelines have built-in error handling properties, such as “Retry Policy”, which specifies the number of retries and the interval between them. Properly configuring these properties can help in managing transient errors without custom logic https://learn.microsoft.com/en-us/training/modules/build-data-pipeline-azure-synapse-analytics/1-introduction .
Monitoring and Logging
To effectively handle exceptions, it is also important to monitor and log the activities within the pipeline. Azure Synapse Analytics provides monitoring features that allow you to track the run status of pipeline activities, which can be used to identify and diagnose errors. Additionally, logging can be configured to capture detailed information about the exceptions, aiding in troubleshooting and improving the robustness of the data integration process https://learn.microsoft.com/en-us/training/modules/build-data-pipeline-azure-synapse-analytics/1-introduction https://learn.microsoft.com/en-us/training/modules/build-data-pipeline-azure-synapse-analytics/8-summary .
Additional Resources
For more information on implementing and debugging pipelines, including exception handling, you can refer to the following resources:
- Iterative development and debugging with Azure Data Factory and Synapse Analytics pipelines: Iterative Development and Debugging https://learn.microsoft.com/en-us/training/modules/build-data-pipeline-azure-synapse-analytics/8-summary .
- Data integration in Azure Synapse Analytics versus Azure Data Factory: Data Integration Concepts https://learn.microsoft.com/en-us/training/modules/build-data-pipeline-azure-synapse-analytics/1-introduction .
By following these guidelines and utilizing the resources provided, you can configure robust exception handling mechanisms within your data integration pipelines, ensuring that your data workflows are reliable and resilient to errors.
Develop data processing (40–45%)
Develop a stream processing solution
Upsert Data
In the realm of data management, the term “upsert” is a portmanteau of “update” and “insert.” It refers to the operation that allows for either inserting a new record into a database or updating an existing record if it matches a certain condition, typically a unique key or identifier. This operation is particularly useful in scenarios where data is being continuously ingested and needs to be refreshed or kept up-to-date without creating duplicates.
When dealing with Azure Synapse Analytics, upsert operations can be performed using dedicated SQL pools. These pools provide the capability to handle large volumes of data and support complex queries, including those required for upsert operations. The process typically involves the following steps:
Staging the Data: Data is initially loaded into a staging table, which temporarily holds the data to be upserted. This staging table structure often mirrors the target table but can also contain additional columns for tracking changes or metadata.
Merging Data: The SQL
MERGEstatement is used to compare the records in the staging table with those in the target table. Based on the comparison, theMERGEstatement can conditionally insert new records or update existing ones. The conditions for merging are usually based on a key that uniquely identifies each record.Handling Deletes: If the upsert operation also needs to handle deletions (records present in the target but not in the staging table), the
MERGEstatement can include a delete action to remove these records.Committing Changes: Once the
MERGEoperation is complete, the changes are committed to the target table, ensuring that the data is up-to-date.
The upsert process is a critical component of ETL (Extract, Transform, Load) workflows, especially in data warehousing scenarios where data integrity and freshness are paramount. Azure Synapse Analytics provides the tools and capabilities to efficiently perform upserts, ensuring that data warehouses remain accurate and reflective of the latest data.
For additional information on how to perform upsert operations within Azure Synapse Analytics, you can refer to the official documentation provided by Microsoft:
Please note that while the URL is provided for reference, it should not be included in the study guide as per the instructions.
Develop data processing (40–45%)
Develop a stream processing solution
Replay Archived Stream Data
In the realm of data analytics, particularly when dealing with streaming data, the ability to replay archived stream data is a valuable feature. This capability allows for the reprocessing of historical data, which can be crucial for various analytical tasks such as backtesting, auditing, and troubleshooting.
Conceptual Overview: Archived stream data refers to the historical data that has been collected from a stream over time. This data is often stored in a persistent storage solution, such as Azure Blob Storage or Azure Data Lake Storage Gen2. The archived data retains the characteristics of the original stream, including the order of events and their associated timestamps.
Practical Applications: - Backtesting: By replaying archived data, analysts can test new analytical models or algorithms against historical data to validate their effectiveness before deploying them in a live environment. - Auditing: Archived streams can be replayed to verify the accuracy of reports or to investigate anomalies that occurred in the past. - Troubleshooting: If a system failure or data processing issue occurs, replaying the relevant portion of the archived stream can help identify the root cause.
Technical Implementation: To replay archived stream data, one would typically use a streaming analytics service such as Azure Stream Analytics. This service allows you to create jobs that can process both live and archived data streams. The inputs for these jobs can include Azure Event Hubs, Azure IoT Hubs, and Azure Blob or Data Lake Gen2 Storage https://learn.microsoft.com/en-us/training/modules/visualize-real-time-data-azure-stream-analytics-power-bi/2-power-bi-output .
When setting up a replay, you would configure the streaming job to read from the location where the archived data is stored. Depending on the system’s capabilities, you might be able to specify a particular time range or other criteria to filter the data that you want to replay.
For additional information on streaming inputs and how to define them in Azure Stream Analytics, you can refer to the Azure documentation: Stream data as input into Stream Analytics https://learn.microsoft.com/en-us/training/modules/visualize-real-time-data-azure-stream-analytics-power-bi/2-power-bi-output .
Considerations: - Ensure that the storage solution used for archiving can handle the scale and retention requirements of your data. - Be aware of the costs associated with storage and the replay process, as large datasets can incur significant expenses. - Consider the impact of replaying data on downstream systems and ensure they can handle the reprocessed data without adverse effects.
By understanding and utilizing the capability to replay archived stream data, organizations can enhance their analytical processes and derive more value from their historical data.
Develop data processing (40–45%)
Manage batches and pipelines
Trigger Batches Explanation
In the realm of data processing, particularly when dealing with Azure Synapse Analytics, the concept of “trigger batches” refers to the initiation of a set of actions or activities within a data pipeline. A data pipeline is a series of data processing steps, and in Azure Synapse Analytics, it consists of various components such as control flows, activities, and triggers .
Triggers are responsible for starting the execution of a pipeline. They can be set up to activate the pipeline under specific conditions or events. There are several types of triggers that can be used to initiate pipeline batches:
Immediate Triggers: These triggers start the pipeline execution as soon as they are activated or manually triggered by a user.
Scheduled Triggers: These are used to run pipelines at predefined times or intervals. For example, a pipeline might be scheduled to run every hour or every day at a certain time.
Event-based Triggers: These triggers respond to events, such as the arrival of new data files in a folder within a data lake. When the specified event occurs, the trigger activates the pipeline to process the new data https://learn.microsoft.com/en-us/training/modules/build-data-pipeline-azure-synapse-analytics/5-run-pipelines .
Monitoring the execution of these triggered batches is crucial for maintaining data processing workflows. Azure Synapse Analytics provides a Monitor page where users can observe the status of individual pipeline runs. This feature is not only essential for troubleshooting but also for tracking the history of pipeline executions, which can be useful for auditing and understanding data lineage https://learn.microsoft.com/en-us/training/modules/build-data-pipeline-azure-synapse-analytics/5-run-pipelines .
For those interested in learning more about the integration of Azure Synapse Analytics with other services, such as Microsoft Purview for data governance, additional resources are available. The integration allows for enhanced tracking of data lineage and data flows, contributing to a more comprehensive data management strategy https://learn.microsoft.com/en-us/training/modules/build-data-pipeline-azure-synapse-analytics/5-run-pipelines .
For further information on setting up and using triggers in Azure Synapse Analytics, you can refer to the following resources:
- Create and manage triggers for a pipeline in Azure Synapse Analytics
- Integrate Microsoft Purview and Azure Synapse Analytics
By understanding and utilizing trigger batches effectively, data professionals can automate their data processing workflows, ensuring timely and efficient handling of data within Azure Synapse Analytics.
Develop data processing (40–45%)
Manage batches and pipelines
Handle Failed Batch Loads
When dealing with batch loads in data processing, it’s crucial to have strategies in place for handling failures. Batch loads can fail due to various reasons, such as data corruption, schema mismatches, or connectivity issues. Here’s a detailed explanation of how to handle failed batch loads effectively:
Monitoring and Alerts: Implement monitoring to track the status of batch jobs. Set up alerts to notify the responsible team or individual when a job fails. This immediate notification allows for a prompt response to investigate and address the issue.
Logging and Diagnostics: Ensure that your batch load processes have comprehensive logging. When a failure occurs, logs can provide valuable insights into the cause of the failure. Diagnostic information should include details about the data source, the nature of the error, and the specific records that caused the failure.
Retry Logic: Incorporate retry logic in your batch load processes. In many cases, transient errors such as temporary network issues can cause batch loads to fail. Automatic retries, with exponential backoff, can resolve these without manual intervention.
Data Validation: Before loading data, perform validation checks to ensure that the data conforms to the expected format and schema. This can prevent many common issues related to data quality that lead to batch load failures.
Error Handling Procedures: Develop standard operating procedures for error handling. This should include steps to isolate the problematic data, correct any issues, and resume the batch load process.
Fallback Mechanisms: In some cases, it may be necessary to revert to a previous state or use a backup data source if a batch load fails. Having a fallback mechanism ensures that the system can continue to operate while the issue is being resolved.
Data Recovery Strategies: Design your system with data recovery in mind. In the event of a failure, it should be possible to recover and reprocess the data without loss.
Documentation and Training: Maintain thorough documentation of the batch load process and error handling procedures. Ensure that team members are trained on these procedures to respond effectively to batch load failures.
For additional information on best practices and handling data loads, you can refer to the Azure Stream Analytics documentation on Power BI output limitations and best practices: Power BI output from Azure Stream Analytics https://learn.microsoft.com/en-us/training/modules/visualize-real-time-data-azure-stream-analytics-power-bi/3-realtime-query .
By following these guidelines, you can minimize the impact of batch load failures and maintain the integrity and reliability of your data processing workflows.
Develop data processing (40–45%)
Manage batches and pipelines
Validating batch loads is a critical step in the data integration process, ensuring that the data loaded into a data warehouse or analytical system is accurate, complete, and meets the required quality standards. The process typically involves several key tasks:
Data Ingestion: Initially, data is ingested into a data lake, often involving pre-load cleansing or transformations to prepare the data for loading into the staging tables https://learn.microsoft.com/en-us/training/modules/design-multidimensional-schema-to-optimize-analytical-workloads/4-load-data .
Loading Staging Tables: The data from files in the data lake is then loaded into staging tables in the relational data warehouse. This step may involve using SQL statements like the
COPYcommand to efficiently move data into the staging environment https://learn.microsoft.com/en-us/training/modules/design-multidimensional-schema-to-optimize-analytical-workloads/4-load-data .Dimension and Fact Table Loading: After the staging tables are populated, the next step is to load the dimension tables with dimension data and fact tables with fact data. This process includes updating existing rows, inserting new rows, and generating surrogate key values as necessary. The fact table loading also involves looking up the appropriate surrogate keys for related dimensions https://learn.microsoft.com/en-us/training/modules/design-multidimensional-schema-to-optimize-analytical-workloads/4-load-data .
Data Validation: Once the data is loaded into the dimension and fact tables, it is essential to validate the data to ensure it has been loaded correctly and completely. This can involve checking row counts, verifying data integrity, and ensuring that surrogate keys have been correctly applied.
Post-Load Optimization: After validation, post-load optimization tasks such as updating indexes and table distribution statistics are performed to ensure that the data warehouse operates efficiently https://learn.microsoft.com/en-us/training/modules/design-multidimensional-schema-to-optimize-analytical-workloads/4-load-data .
For additional information on implementing an effective data warehouse loading solution, including managing surrogate keys and slowly changing dimensions, you can refer to the module “Load data into a relational data warehouse” available at Load data into a relational data warehouse https://learn.microsoft.com/en-us/training/modules/design-multidimensional-schema-to-optimize-analytical-workloads/4-load-data .
It’s important to note that the specific tools and techniques used for validating batch loads can vary depending on the technology platform. For instance, in Azure Synapse Analytics, you can combine ingested streaming data with batch-processed data or data synchronized from operational data sources using Azure Synapse Link https://learn.microsoft.com/en-us/training/modules/ingest-streaming-data-use-azure-stream-analytics-synapse/5-run-job-ingest . Additionally, Azure Synapse Analytics allows you to use Apache Spark for data ingestion, processing, and analysis, which can be configured and run within the same environment as other analytical runtimes https://learn.microsoft.com/en-us/training/modules/understand-big-data-engineering-with-apache-spark-azure-synapse-analytics/1-introduction .
Understanding the distinction between OLTP (online transaction processing) and OLAP (online analytical processing) systems is also beneficial, as it highlights the different optimization strategies for transactional versus analytical processing. OLTP systems are optimized for immediate response to discrete system or user requests, while OLAP systems are optimized for analytical processing of large sets of historical data https://learn.microsoft.com/en-us/training/modules/design-hybrid-transactional-analytical-processing-using-azure-synapse-analytics/2-understand-patterns .
Lastly, Data Lake Storage Gen2 can be used as the foundation for both real-time and batch solutions, handling a variety of data at exabyte scale and providing the throughput needed for large-scale data processing https://learn.microsoft.com/en-us/training/modules/introduction-to-azure-data-lake-storage/2-azure-data-lake-gen2 .
Develop data processing (40–45%)
Manage batches and pipelines
Manage Data Pipelines in Azure Data Factory or Azure Synapse Pipelines
Managing data pipelines in Azure Data Factory or Azure Synapse Pipelines involves several key activities that ensure the efficient movement and transformation of data within the Azure ecosystem. Here is a detailed explanation of the process:
Understanding Pipelines
Pipelines are a mechanism for defining and orchestrating data movement activities, which are essential in automating extract, transform, and load (ETL) workloads as part of a broader enterprise analytical solution https://learn.microsoft.com/en-us/training/modules/build-data-pipeline-azure-synapse-analytics/1-introduction . Azure Synapse Analytics pipelines are built on the same technology as Azure Data Factory and offer a similar authoring experience https://learn.microsoft.com/en-us/training/modules/build-data-pipeline-azure-synapse-analytics/1-introduction .
Components of Pipelines
Pipelines encapsulate a sequence of activities that perform data movement and processing tasks. These activities can be orchestrated through control flow activities that manage branching, looping, and other typical processing logic https://learn.microsoft.com/en-us/training/modules/build-data-pipeline-azure-synapse-analytics/2-understand-pipelines-azure-synapse-analytics . The graphical design tools in Azure Synapse Studio enable the construction of complex pipelines with minimal or no coding https://learn.microsoft.com/en-us/training/modules/build-data-pipeline-azure-synapse-analytics/2-understand-pipelines-azure-synapse-analytics .
Creating and Debugging Pipelines
Azure Synapse Analytics provides data integration services through the creation of pipelines, supporting complex ETL solutions for enterprise data analytics https://learn.microsoft.com/en-us/training/modules/build-data-pipeline-azure-synapse-analytics/8-summary . For guidance on developing and debugging pipelines, the following resource can be consulted: Iterative development and debugging with Azure Data Factory and Synapse Analytics pipelines https://learn.microsoft.com/en-us/training/modules/build-data-pipeline-azure-synapse-analytics/8-summary .
Publishing and Triggering Pipelines
Once a pipeline is ready, it can be published and triggered to run immediately, at scheduled intervals, or in response to an event, such as the addition of new data files to a folder in a data lake https://learn.microsoft.com/en-us/training/modules/build-data-pipeline-azure-synapse-analytics/5-run-pipelines .
Monitoring Pipelines
The Monitor page in Azure Synapse Studio allows for the monitoring of individual pipeline runs, which is useful for troubleshooting and tracking data lineage data flows https://learn.microsoft.com/en-us/training/modules/build-data-pipeline-azure-synapse-analytics/5-run-pipelines . For more information on monitoring pipelines, refer to the following resource: Monitor Pipelines in Azure Synapse Analytics https://learn.microsoft.com/en-us/training/modules/build-data-pipeline-azure-synapse-analytics/5-run-pipelines .
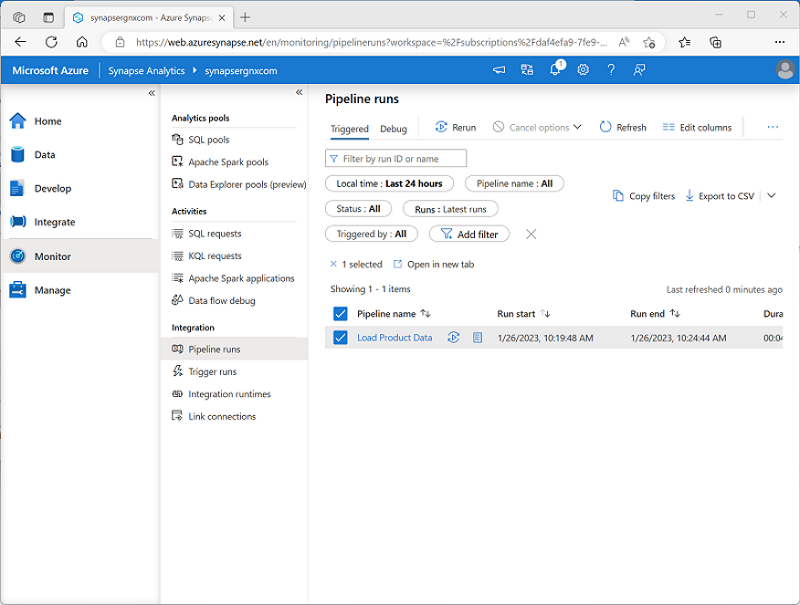
Integrating with Apache Spark
Azure Synapse Analytics pipelines can orchestrate data transfer and transformation activities across multiple systems. When working with analytical data in a data lake, Apache Spark provides a scalable, distributed processing platform. The Synapse Notebook activity allows for the running of data processing code in Spark notebooks as a task in a pipeline, automating big data processing and integrating it into ETL workloads https://learn.microsoft.com/en-us/training/modules/use-spark-notebooks-azure-synapse-pipeline/1-introduction .
For additional information on managing data pipelines in Azure Data Factory or Azure Synapse Pipelines, the following resources may be helpful: - Data integration in Azure Synapse Analytics versus Azure Data Factory https://learn.microsoft.com/en-us/training/modules/build-data-pipeline-azure-synapse-analytics/1-introduction . - Integrate Microsoft Purview and Azure Synapse Analytics https://learn.microsoft.com/en-us/training/modules/build-data-pipeline-azure-synapse-analytics/5-run-pipelines .
By understanding and utilizing these components and resources, you can effectively manage data pipelines to support your data integration and analytical needs within Azure.
Develop data processing (40–45%)
Manage batches and pipelines
Scheduling Data Pipelines in Data Factory or Azure Synapse Pipelines
When working with data integration services in Azure, scheduling data pipelines is a crucial aspect of automating and orchestrating extract, transform, and load (ETL) workloads. Both Azure Data Factory and Azure Synapse Analytics pipelines provide the capability to define and manage these data movement activities. It is important to note that Azure Synapse Analytics pipelines are built on the same technology as Azure Data Factory and offer a similar authoring experience https://learn.microsoft.com/en-us/training/modules/build-data-pipeline-azure-synapse-analytics/1-introduction .
Implementing Schedules in Pipelines
To schedule a pipeline, you can use triggers. Triggers in Azure Synapse Analytics and Azure Data Factory are used to initiate the execution of a pipeline according to a defined schedule or in response to an event. There are three main types of triggers:
- On-demand Triggers: These triggers allow you to run the pipeline immediately upon request.
- Scheduled Triggers: With scheduled triggers, you can set up pipelines to run at specific intervals, such as hourly, daily, or weekly. This is useful for regular batch processing tasks.
- Event-based Triggers: These triggers initiate a pipeline run in response to an event, such as the arrival of new data files in a data lake https://learn.microsoft.com/en-us/training/modules/build-data-pipeline-azure-synapse-analytics/5-run-pipelines .
Monitoring Scheduled Pipelines
Once a pipeline is published and triggered, you can monitor its runs through the Monitor page in Azure Synapse Studio. This monitoring capability is essential for troubleshooting and ensuring that the pipeline is executing as expected. It also allows you to track the history of pipeline runs, which can be used for auditing and understanding data lineage when integrated with services like Microsoft Purview https://learn.microsoft.com/en-us/training/modules/build-data-pipeline-azure-synapse-analytics/5-run-pipelines .
Best Practices for Scheduling
When scheduling pipelines, consider the following best practices:
- Consistency: Ensure that the scheduled times align with the availability of data sources and the expected workload patterns.
- Resource Optimization: Schedule pipelines during off-peak hours if possible to optimize the use of resources and minimize costs.
- Error Handling: Implement error handling and retry mechanisms to manage failures in scheduled runs.
- Monitoring: Regularly monitor pipeline runs and performance to quickly identify and resolve any issues.
Additional Resources
For more detailed information on developing, debugging, and scheduling pipelines, you can refer to the following resources:
- Data integration in Azure Synapse Analytics versus Azure Data Factory https://learn.microsoft.com/en-us/training/modules/build-data-pipeline-azure-synapse-analytics/1-introduction .
- Iterative development and debugging with Azure Data Factory and Synapse Analytics pipelines https://learn.microsoft.com/en-us/training/modules/build-data-pipeline-azure-synapse-analytics/8-summary .
- Integrate Microsoft Purview and Azure Synapse Analytics https://learn.microsoft.com/en-us/training/modules/build-data-pipeline-azure-synapse-analytics/5-run-pipelines .
By following these guidelines and utilizing the provided resources, you can effectively schedule and manage data pipelines in Azure Data Factory or Azure Synapse Analytics, ensuring that your ETL processes are automated, reliable, and efficient.
Develop data processing (40–45%)
Manage batches and pipelines
Implementing Version Control for Pipeline Artifacts
Version control is a critical aspect of software development and data engineering, as it allows you to track changes, collaborate with others, and revert to previous states of your code or artifacts. In the context of Azure Synapse Analytics, implementing version control for pipeline artifacts is essential for managing the lifecycle of data integration and data flow activities.
Azure Synapse Pipelines and Version Control
Azure Synapse Pipelines is a service that enables the creation, execution, and management of data integration and data flow activities. These pipelines are composed of various activities that can be orchestrated to perform complex data transformations and transfers https://learn.microsoft.com/en-us/training/modules/use-spark-notebooks-azure-synapse-pipeline/2-understand-notebooks-pipelines .
To implement version control for pipeline artifacts in Azure Synapse Analytics, you can use the following best practices:
Integration with Source Control Systems: Azure Synapse Analytics supports integration with source control systems like GitHub and Azure DevOps. By connecting your Synapse workspace to a source control repository, you can manage your pipeline artifacts just like any other codebase.
Branching Strategy: Adopt a branching strategy that suits your team’s workflow. Common strategies include feature branching, Gitflow, and trunk-based development. This allows you to work on different features or fixes without affecting the main codebase until they are ready to be merged.
Code Reviews and Pull Requests: Use pull requests to review code changes before they are merged into the main branch. This practice helps ensure that the pipeline artifacts are reviewed by peers and meet the team’s quality standards.
Automated Testing: Implement automated tests for your pipelines to validate their functionality before deploying changes. This can include unit tests for individual activities and integration tests for the entire pipeline.
Continuous Integration/Continuous Deployment (CI/CD): Set up CI/CD pipelines to automate the deployment of pipeline artifacts. This ensures that changes are automatically tested and deployed to the appropriate environments, reducing manual errors and deployment times.
Artifact Versioning: Version your pipeline artifacts by tagging commits in your source control system. This allows you to track which version of the pipeline is deployed and roll back to previous versions if necessary.
Documentation: Maintain clear documentation for your pipelines, including the purpose of each pipeline, the data sources and destinations involved, and any dependencies. This documentation should be versioned alongside your pipeline code.
Monitoring and Auditing: Use monitoring tools to track the execution of your pipelines and audit logs to keep a record of changes. This helps in troubleshooting issues and understanding the impact of changes over time.
For additional information on Azure Synapse Pipelines and best practices for version control, you can refer to the following resources:
- Azure Synapse Analytics documentation
- Source control in Azure Synapse Studio
- Continuous integration and delivery in Azure Synapse Analytics
By following these guidelines, you can effectively implement version control for your Azure Synapse Pipeline artifacts, ensuring a robust and collaborative data engineering process.
Develop data processing (40–45%)
Manage batches and pipelines
Manage Spark Jobs in a Pipeline
Apache Spark is a powerful, distributed processing system used for big data workloads. It is designed to handle batch and stream processing and is capable of running a wide variety of applications, including ETL tasks, interactive analytics, and machine learning https://learn.microsoft.com/en-us/training/modules/understand-big-data-engineering-with-apache-spark-azure-synapse-analytics/3-use-spark . In Azure Synapse Analytics, Spark can be integrated into pipelines to automate and manage these big data tasks efficiently.
Integration of Spark with Azure Synapse Pipelines
Azure Synapse Analytics pipelines provide a mechanism for orchestrating data movement and transformation activities. These pipelines can include a variety of activities, and one of the key components is the ability to manage Spark jobs within them https://learn.microsoft.com/en-us/training/modules/build-data-pipeline-azure-synapse-analytics/1-introduction .
The Synapse Notebook activity in Azure Synapse Analytics pipelines allows you to run Spark notebooks as part of your data processing workflows. This integration enables you to automate big data processing tasks and incorporate them into your ETL workloads https://learn.microsoft.com/en-us/training/modules/use-spark-notebooks-azure-synapse-pipeline/1-introduction .
Running Spark Notebooks in Pipelines
Spark notebooks, which are integrated into Azure Synapse Studio, offer an interactive environment for data exploration and experimentation. They combine code with Markdown notes, making them a familiar tool for data scientists and analysts. The interface is similar to Jupyter notebooks, a popular open-source platform https://learn.microsoft.com/en-us/training/modules/understand-big-data-engineering-with-apache-spark-azure-synapse-analytics/3-use-spark .
When the transformation logic in a Spark notebook is finalized, it can be optimized for maintainability and then included in a pipeline. The pipeline can be scheduled to run at specific times or triggered by events, such as the arrival of new data files in a data lake https://learn.microsoft.com/en-us/training/modules/use-spark-notebooks-azure-synapse-pipeline/2-understand-notebooks-pipelines .
Configuring Spark Pools for Pipelines
To run a notebook within a pipeline, it is executed on a Spark pool, which can be configured with the necessary compute resources and Spark runtime to suit the specific workload. The pipeline’s integration runtime orchestrates the activities, coordinating the external services required to run them https://learn.microsoft.com/en-us/training/modules/use-spark-notebooks-azure-synapse-pipeline/2-understand-notebooks-pipelines .
Best Practices for Spark Notebooks
When working with Spark notebooks in pipelines, several best practices can enhance efficiency and effectiveness:
- Code Organization: Use clear and descriptive names for variables and functions, and organize code into small, reusable segments https://learn.microsoft.com/en-us/training/modules/use-spark-notebooks-azure-synapse-pipeline/2-understand-notebooks-pipelines .
- Caching: Spark allows caching of intermediate results, which can improve notebook performance https://learn.microsoft.com/en-us/training/modules/use-spark-notebooks-azure-synapse-pipeline/2-understand-notebooks-pipelines .
- Computation Optimization: Be mindful of the computations you perform to avoid unnecessary steps https://learn.microsoft.com/en-us/training/modules/use-spark-notebooks-azure-synapse-pipeline/2-understand-notebooks-pipelines .
- Use of Collect(): Avoid using the
collect()method unless necessary, as it can be inefficient with large datasets https://learn.microsoft.com/en-us/training/modules/use-spark-notebooks-azure-synapse-pipeline/2-understand-notebooks-pipelines . - Monitoring with Spark UI: Utilize Spark’s web-based UI for detailed information on job performance for monitoring and debugging https://learn.microsoft.com/en-us/training/modules/use-spark-notebooks-azure-synapse-pipeline/2-understand-notebooks-pipelines .
- Dependency Management: Keep dependencies version-consistent and updated, using the latest versions of Spark and other libraries when possible https://learn.microsoft.com/en-us/training/modules/use-spark-notebooks-azure-synapse-pipeline/2-understand-notebooks-pipelines .
Additional Resources
For more information on working with Spark notebooks and pipelines in Azure Synapse Analytics, you can refer to the following resources:
- Create, develop, and maintain Synapse notebooks in Azure Synapse Analytics https://learn.microsoft.com/en-us/training/modules/understand-big-data-engineering-with-apache-spark-azure-synapse-analytics/3-use-spark .
- Data integration in Azure Synapse Analytics versus Azure Data Factory https://learn.microsoft.com/en-us/training/modules/build-data-pipeline-azure-synapse-analytics/1-introduction .
- Use Spark notebooks in an Azure Synapse pipeline https://learn.microsoft.com/en-us/training/modules/use-spark-notebooks-azure-synapse-pipeline/2-understand-notebooks-pipelines .
By following these guidelines and utilizing the provided resources, you can effectively manage Spark jobs within Azure Synapse Analytics pipelines, streamlining your big data processing and ETL workflows.
Secure, monitor, and optimize data storage and data processing (30–35%)
Implement data security
Implementing data masking involves obscuring specific data within a database to protect sensitive information. Data masking is essential for maintaining privacy and compliance with regulations, as it allows non-sensitive equivalent data to be used in place of the actual data for purposes such as user training, software testing, and analytics.
Here is a detailed explanation of how to implement data masking:
Identify Sensitive Data: Determine which data needs to be masked. This typically includes personally identifiable information (PII), financial details, health records, or any other sensitive data.
Choose Masking Techniques: Select appropriate masking techniques for the data. Common methods include substitution, shuffling, encryption, and redaction. Each technique offers a different level of protection and usability for the masked data.
Define Masking Rules: Establish rules that dictate how data masking is applied. These rules should consider the context in which the data is used and the required level of data fidelity.
Implement Masking Logic: Apply the masking rules to the data. This can be done through scripts, database queries, or specialized data masking tools that automate the process.
Test Masked Data: Verify that the masked data maintains its usability for its intended purpose while ensuring that the sensitive information is adequately protected.
Monitor and Audit: Continuously monitor the masked data to ensure compliance with data protection policies and regulations. Regular audits can help identify any potential exposure of sensitive data.
For additional information on data masking and best practices, you can refer to the following resources:
Please note that while data masking can significantly reduce the risk of sensitive data exposure, it is not a substitute for other security measures such as access controls and encryption. It should be part of a comprehensive data protection strategy.
Remember to review and comply with all relevant regulations and organizational policies when implementing data masking to ensure that the approach meets legal and ethical standards.
Secure, monitor, and optimize data storage and data processing (30–35%)
Implement data security
Encrypt Data at Rest and in Motion
When securing data within a data storage and analytics environment, it is crucial to ensure that data is protected both at rest and in motion.
Encrypting Data at Rest: Data at rest refers to inactive data that is stored physically in any digital form. Encryption at rest is designed to prevent unauthorized access to the data when it is stored. Azure Data Lake Storage, for instance, provides robust security features for data at rest. It supports access control lists (ACLs) and Portable Operating System Interface (POSIX) permissions that are set at the directory or file level, rather than inheriting permissions from the parent directory. This allows for granular control over who can access the data https://learn.microsoft.com/en-us/training/modules/introduction-to-azure-data-lake-storage/2-azure-data-lake-gen2 .
All data stored in Azure Data Lake Storage is encrypted using either Microsoft-managed keys or customer-managed keys. Microsoft-managed keys are handled by Azure and are used to encrypt the data by default. Customer-managed keys offer an additional layer of control, as customers can manage their own encryption keys https://learn.microsoft.com/en-us/training/modules/introduction-to-azure-data-lake-storage/2-azure-data-lake-gen2 .
For more information on data encryption at rest in Azure, you can visit: - Azure Data Lake Storage Encryption
Encrypting Data in Motion: Data in motion refers to data actively moving from one location to another, such as across the internet or through a private network. Encryption in motion is intended to protect your data if it is intercepted or accessed as it travels from one system to another.
Azure services ensure that data in motion is secured using Transport Layer Security (TLS), which provides encryption, integrity, and authentication. This means that data sent to and from Azure services is protected against tampering and eavesdropping https://learn.microsoft.com/en-us/training/modules/introduction-to-azure-data-lake-storage/2-azure-data-lake-gen2 .
For additional details on securing data in motion, you can refer to: - Azure Data Transfer Security
By implementing encryption for both data at rest and in motion, organizations can significantly reduce the risk of unauthorized data access and ensure compliance with various regulatory requirements. It is an essential aspect of a comprehensive data security strategy.
Secure, monitor, and optimize data storage and data processing (30–35%)
Implement data security
Implementing Row-Level and Column-Level Security
When designing a secure data solution, it is crucial to control access to the data at a granular level. Implementing row-level and column-level security allows you to define precise access permissions for different users or groups, ensuring that they can only access the data they are authorized to see.
Row-Level Security (RLS)
Row-level security enables you to control access to rows in a database table based on the characteristics of the user executing a query. For instance, you can restrict a salesperson to only view data related to their sales region.
To implement RLS, you typically create security policies that include security predicates. These predicates are functions that determine access to rows based on user attributes or session context. RLS is transparent to the user, and it works with shared data without the need for application changes.
Column-Level Security
Column-level security restricts access to specific columns within a table. This means that even if a user has access to a table, they may not have access to all the data within that table. For example, you might hide sensitive columns like Social Security numbers or personal email addresses from certain users.
To implement column-level security, you can define permissions on individual columns. Users with sufficient permissions can view the data in these columns, while others cannot.
Implementing Security in Azure Synapse Analytics
In Azure Synapse Analytics, you can implement row-level security by creating views that filter rows based on user context or by using security predicates within the database. For column-level security, you can grant or deny permissions on specific columns to certain users or roles.
For additional information on implementing row-level and column-level security in Azure Synapse Analytics, refer to the following resources: - Row-level security in SQL Database and Azure Synapse Analytics - Column-level security in Azure Synapse Analytics
By carefully implementing row-level and column-level security, you can ensure that your data solution is not only robust and scalable but also compliant with data privacy regulations and internal data governance policies.
Secure, monitor, and optimize data storage and data processing (30–35%)
Implement data security
Implementing Azure Role-Based Access Control (RBAC)
Azure Role-Based Access Control (RBAC) is a system that provides fine-grained access management for Azure resources. Implementing RBAC allows organizations to grant users only the access that they need to perform their jobs. Here’s a detailed explanation of how to implement Azure RBAC:
Understanding RBAC: RBAC in Azure is based on a combination of roles, permissions, and scopes. Roles define a set of permissions, such as the ability to read or write to a resource. Scopes determine the level at which access is granted, such as a specific resource, a resource group, or an entire subscription.
Identifying Roles: Azure provides several built-in roles, such as Owner, Contributor, Reader, and User Access Administrator. Each role encompasses specific permissions. For example, the Contributor role allows a user to manage all resources but does not allow them to grant access to others.
Custom Roles: If the built-in roles do not meet the specific needs of your organization, you can create custom roles with a tailored set of permissions.
Assigning Roles: Roles can be assigned to Azure Active Directory (AD) users, groups, service principals, or managed identities. Assignments can be done through the Azure portal, Azure CLI, Azure PowerShell, or the REST API.
Managing Access: It is important to regularly review and audit role assignments to ensure that the correct level of access is maintained. This can be done through the Azure portal or by using tools like Azure Policy to enforce organizational standards.
Using Conditional Access: For added security, you can implement Conditional Access policies that require users to meet certain conditions before accessing Azure resources, such as requiring multi-factor authentication.
Monitoring and Auditing: Azure provides logs and reports that help monitor RBAC changes and access patterns. This information can be used to ensure compliance with company policies and regulatory requirements.
For additional information on implementing Azure RBAC, you can refer to the following resources:
- What is Azure role-based access control (Azure RBAC)?
- Built-in roles for Azure resources
- Steps to create or update a custom role in Azure RBAC
- Manage access to Azure resources using RBAC and the Azure portal
- Azure Active Directory Conditional Access
By following these steps and utilizing the provided resources, you can effectively implement Azure RBAC to manage access to your Azure resources securely and efficiently.
Secure, monitor, and optimize data storage and data processing (30–35%)
Implement data security
Implementing POSIX-like Access Control Lists (ACLs) for Data Lake Storage Gen2
Azure Data Lake Storage Gen2 supports POSIX-like Access Control Lists (ACLs), which are essential for managing permissions in a granular and secure manner. Unlike traditional POSIX permissions, ACLs in Data Lake Storage Gen2 do not inherit permissions from the parent directory. This feature allows administrators to set permissions at both the directory and file level within the data lake, ensuring a secure storage system.
To implement POSIX-like ACLs in Data Lake Storage Gen2, follow these steps:
Access Control Configuration: Use technologies such as Hive and Spark or utilities like Azure Storage Explorer to configure ACLs. Azure Storage Explorer is compatible with Windows, macOS, and Linux, providing a versatile tool for managing access controls.
Setting Permissions: Define permissions at the directory or file level to control access to the data stored within the data lake. This granularity ensures that only authorized users or processes can access or modify the data.
Encryption at Rest: All data within Data Lake Storage Gen2 is encrypted at rest. You can choose to use Microsoft-managed keys or customer-managed keys for encryption, adding an additional layer of security to your data.
Managing ACLs: Regularly review and update ACLs to reflect changes in access requirements. This proactive management helps maintain the integrity and confidentiality of the data.
For more detailed information on provisioning an Azure Data Lake Storage Gen2 account and implementing ACLs, refer to the following resources:
- Create a storage account to use with Azure Data Lake Storage Gen2
- Introduction to Azure Data Lake Storage Gen2
By following these guidelines, you can effectively implement POSIX-like ACLs for Data Lake Storage Gen2, ensuring that your data lake is secure and that permissions are appropriately managed https://learn.microsoft.com/en-us/training/modules/introduction-to-azure-data-lake-storage/2-azure-data-lake-gen2 https://learn.microsoft.com/en-us/training/modules/implement-synapse-link-for-sql/4-synapse-link-sql-server https://learn.microsoft.com/en-us/training/modules/introduction-to-azure-data-lake-storage/8-summary .
Secure, monitor, and optimize data storage and data processing (30–35%)
Implement data security
Implementing a data retention policy is a critical aspect of managing data lifecycle and ensuring compliance with various regulations. A data retention policy defines how long data should be kept and the conditions under which it should be archived or deleted. Here’s a detailed explanation of how to implement a data retention policy in the context of Azure services:
Azure Cosmos DB Analytical Store
For Azure Cosmos DB, you can implement a data retention policy by configuring the Analytical Store Time-to-Live (TTL) settings. This can be done using Azure PowerShell or Azure CLI.
Azure PowerShell: Use the
New-AzCosmosDBSqlContainercmdlet to create a new container orUpdate-AzCosmosDBSqlContainerto modify an existing container with the-AnalyticalStorageTtlparameter. Setting this parameter to-1enables permanent retention of analytical data https://learn.microsoft.com/en-us/training/modules/configure-azure-synapse-link-with-azure-cosmos-db/3-create-analytical-store-enabled-container .New-AzCosmosDBSqlContainer -ResourceGroupName "my-rg" -AccountName "my-cosmos-db" -DatabaseName "my-db" -Name "my-container" -PartitionKeyKind "hash" -PartitionKeyPath "/productID" -AnalyticalStorageTtl -1Azure CLI: Use the
az cosmosdb sql container createcommand to create a new container oraz cosmosdb sql container updateto configure an existing container with the--analytical-storage-ttlparameter. Again, setting this parameter to-1ensures permanent retention https://learn.microsoft.com/en-us/training/modules/configure-azure-synapse-link-with-azure-cosmos-db/3-create-analytical-store-enabled-container .az cosmosdb sql container create --resource-group my-rg --account-name my-cosmos-db --database-name my-db --name my-container --partition-key-path "/productID" --analytical-storage-ttl -1
Azure Data Factory
In Azure Data Factory, you can create a pipeline with a Copy Data activity to move data to a location that aligns with your retention policy. The JSON definition of a pipeline can be edited to include activities that copy data to or from storage that is managed according to your retention policy https://learn.microsoft.com/en-us/training/modules/build-data-pipeline-azure-synapse-analytics/3-create-pipeline-azure-synapse-studio .
Data Governance with Microsoft Purview
Understanding where sensitive data resides and how it is classified is essential for implementing a data retention policy. Microsoft Purview provides tools for discovering, classifying, and protecting sensitive data across your organization. It helps ensure compliance with security policies and regulations https://learn.microsoft.com/en-us/training/modules/intro-to-microsoft-purview/4-when-to-use-microsoft-purview .
Delta Lake on Azure Synapse Analytics
Delta Lake is an open-source storage layer that brings reliability to Data Lakes. It provides ACID transactions, scalable metadata handling, and unifies streaming and batch data processing. Delta Lake tables can be used to enforce data retention policies by time-traveling to older snapshots of data or by deleting old data that is no longer needed https://learn.microsoft.com/en-us/training/modules/use-delta-lake-azure-synapse-analytics/1-introduction .
For more information on implementing data retention policies and managing the data lifecycle on Azure, you can refer to the following resources:
- Azure Cosmos DB Analytical Store
- Azure Data Factory Documentation
- Microsoft Purview Documentation
- Delta Lake on Azure Synapse Analytics
Please note that the URLs provided are for additional information and are not meant to be included in the study guide as per the instruction to exclude explicit mention of the exam.
Secure, monitor, and optimize data storage and data processing (30–35%)
Implement data security
Implement Secure Endpoints (Private and Public)
When designing a data solution in Azure, it is crucial to implement secure endpoints to protect data while allowing controlled access. Secure endpoints can be categorized into two types: private and public.
Private Endpoints are network interfaces that connect you privately and securely to Azure services. They are part of your virtual network and provide the following benefits:
- Data Exfiltration Protection: Private endpoints are mapped to a specific resource in Azure and prevent data from being accessed outside of that resource.
- Secure Connectivity: The connection from your virtual network to the Azure service uses a private IP address from your VNet, ensuring Azure traffic remains on the Microsoft network.
Public Endpoints, on the other hand, are accessible over the internet. While they allow easy access to services, they must be secured properly to prevent unauthorized access. Security measures for public endpoints include:
- Firewall Rules: Configuring firewall rules to limit access to only trusted IP addresses.
- Virtual Network Service Endpoints: Extending your virtual network’s private address space and the identity of your VNet to Azure services over a direct connection.
Both types of endpoints can be implemented in Azure services such as Azure Synapse Analytics, Azure SQL Database, and Azure Data Lake Storage Gen2. For instance, Azure Synapse Analytics supports managed private endpoints which can be created within the Synapse workspace to allow secure and private connectivity to linked services https://learn.microsoft.com/en-us/training/modules/build-data-pipeline-azure-synapse-analytics/2-understand-pipelines-azure-synapse-analytics .
For additional information on implementing secure endpoints in Azure services, you can refer to the following URLs:
- For Azure Synapse Analytics: Create and configure a self-hosted integration runtime https://learn.microsoft.com/en-us/training/modules/implement-synapse-link-for-sql/4-synapse-link-sql-server .
- For Azure SQL Database and Azure Synapse Link: Implement Synapse Link for Azure SQL Database https://learn.microsoft.com/en-us/training/modules/implement-synapse-link-for-sql/3-synapse-link-azure-sql .
- For Azure Data Lake Storage Gen2: Introduction to Azure Data Lake Storage https://learn.microsoft.com/en-us/training/modules/introduction-to-azure-data-lake-storage/6-use-cases .
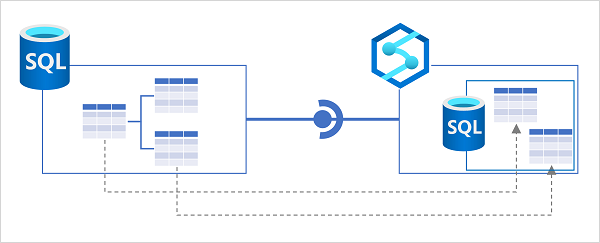
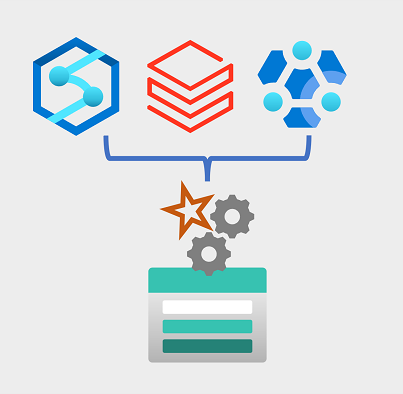
By implementing these secure endpoints, you can ensure that your Azure data solutions are not only robust and scalable but also secure from unauthorized access.
Implementing Resource Tokens in Azure Databricks
Azure Databricks is an analytics platform optimized for the Microsoft Azure cloud services platform. It provides a collaborative environment with Azure for streaming, machine learning, and big data. When working with Azure Databricks in the context of data security and access control, resource tokens play a crucial role.
Resource tokens are a way to provide secure access to resources within Azure Databricks. They are used to delegate access to specific resources without sharing the primary account keys. This is particularly useful when you need to provide limited access to external users or services.
To implement resource tokens in Azure Databricks, you would typically follow these steps:
Create a Databricks Service Principal: A service principal is an identity created for use with applications, hosted services, and automated tools to access Azure resources. This can be done through Azure Active Directory.
Assign Roles to the Service Principal: Determine the level of access required and assign appropriate roles to the service principal. Azure has built-in roles such as Contributor, Reader, and Owner, which can be assigned at different scopes.
Generate a Resource Token: Once the service principal has been created and assigned roles, you can generate a resource token. This token will be used by the service principal to authenticate and authorize its actions within Azure Databricks.
Use the Token to Access Resources: The resource token can be used in API calls or Databricks CLI commands to access Azure Databricks resources. The token encapsulates the permissions granted to the service principal, ensuring that only authorized operations are allowed.
Monitor and Manage Tokens: Keep track of the resource tokens issued and manage their lifecycle. Tokens can be revoked when they are no longer needed or if they are compromised.
It is important to note that while resource tokens provide a secure way to access resources, they should be handled with care. Tokens should not be shared broadly and should be stored securely to prevent unauthorized access.
For more detailed information on implementing resource tokens and managing access control in Azure Databricks, you can refer to the official Azure Databricks documentation and Azure Active Directory documentation provided by Microsoft.
Secure, monitor, and optimize data storage and data processing (30–35%)
Implement data security
Loading a DataFrame with Sensitive Information
When working with sensitive information, it is crucial to handle data with care to comply with security policies and regulations. A DataFrame can be loaded with sensitive data by following a structured process that ensures data governance and protection.
Step 1: Load the Data into a DataFrame
To load sensitive data into a DataFrame, you would typically use the
spark.read function, specifying the file format and path.
For instance, if you have a CSV file containing sensitive information,
you can load it as follows:
df = spark.read.load('/path/to/sensitive_data.csv', format='csv', header=True)This code snippet will create a DataFrame df by reading
data from the specified CSV file, assuming that the first row contains
headers https://learn.microsoft.com/en-us/training/modules/transform-data-spark-azure-synapse-analytics/2-transform-dataframe
.
Step 2: Understand and Protect Sensitive Information
Once the data is loaded into a DataFrame, it is essential to identify and understand which parts of the data are sensitive. Sensitive data might include personal identifiers like social security numbers, credit card numbers, or other personal information https://learn.microsoft.com/en-us/training/modules/intro-to-microsoft-purview/4-when-to-use-microsoft-purview .
Step 3: Apply Data Governance Practices
After identifying sensitive data within the DataFrame, apply appropriate data governance practices. This includes classifying the data, applying access controls, and ensuring that the data is handled in compliance with company security policies, government regulations, and customer needs https://learn.microsoft.com/en-us/training/modules/intro-to-microsoft-purview/4-when-to-use-microsoft-purview .
Step 4: Persist the Data with Care
If you need to save the DataFrame containing sensitive information, you should do so in a secure and governed manner. For example, saving the DataFrame in Delta Lake format provides transactional consistency and versioning, which are important for data governance:
delta_table_path = "/delta/sensitive_data"
df.write.format("delta").save(delta_table_path)
This will save the DataFrame to the specified path in Delta Lake
format, which includes Parquet files for the data and a
_delta_log folder for the transaction log https://learn.microsoft.com/en-us/training/modules/use-delta-lake-azure-synapse-analytics/3-create-delta-tables
.
Additional Resources
For more information on working with sensitive data and data governance, you can refer to the following resources: - Data Governance in Microsoft Purview - Delta Lake Documentation
By following these steps and utilizing the provided resources, you can ensure that sensitive information within a DataFrame is loaded, handled, and stored securely, adhering to the best practices of data governance.
Secure, monitor, and optimize data storage and data processing (30–35%)
Implement data security
Write Encrypted Data to Tables or Parquet Files
When dealing with data storage and management, security is a paramount concern. Writing encrypted data to tables or Parquet files is a practice that ensures sensitive information is protected both at rest and during transmission. Here’s a detailed explanation of how this can be achieved within Azure Synapse Analytics and Azure Data Lake Storage:
Azure Synapse Analytics - Lake Databases
Azure Synapse Analytics introduces the concept of lake databases, which allow you to benefit from the flexibility of a data lake while maintaining a structured schema similar to a relational database. This schema is decoupled from the file-based storage, meaning that the data files can be stored in a data lake and still be managed with the relational schema of tables and views https://learn.microsoft.com/en-us/training/modules/create-metadata-objects-azure-synapse-serverless-sql-pools/1-introduction .
Managed Tables and Parquet Files
In Azure Synapse Analytics, you can create managed tables that store
data in a structured format. When saving a dataframe as a managed table,
you can use the saveAsTable operation with the “delta”
format, which supports ACID transactions and can be encrypted https://learn.microsoft.com/en-us/training/modules/use-delta-lake-azure-synapse-analytics/4-catalog-tables
. Parquet is a columnar storage file format optimized for use with big
data processing frameworks like Apache Spark. It is known for its
efficiency and performance, and it supports encryption at rest .
Data Lake Storage Gen2 - Security and Encryption
Azure Data Lake Storage Gen2 provides robust security features, including access control lists (ACLs) and POSIX permissions that can be set at the directory or file level. This granular level of security ensures that data stored within the data lake is well-protected https://learn.microsoft.com/en-us/training/modules/introduction-to-azure-data-lake-storage/2-azure-data-lake-gen2 . All data in Data Lake Storage Gen2 is encrypted at rest using either Microsoft-managed keys or customer-managed keys, providing an additional layer of security for stored data https://learn.microsoft.com/en-us/training/modules/introduction-to-azure-data-lake-storage/2-azure-data-lake-gen2 .
Writing Encrypted Data
When writing data to Azure Data Lake Storage Gen2, you can use a Blob storage/ADLS Gen2 output in Azure Synapse Analytics. This output allows you to specify the file format, including Parquet, and ensures that the data is encrypted https://learn.microsoft.com/en-us/training/modules/ingest-streaming-data-use-azure-stream-analytics-synapse/3-configure-inputs-outputs . You can also configure the output to control the write mode, which determines how data is written to the storage, ensuring data integrity and security https://learn.microsoft.com/en-us/training/modules/ingest-streaming-data-use-azure-stream-analytics-synapse/3-configure-inputs-outputs .
For more information on writing encrypted data to tables or Parquet files in Azure Synapse Analytics and Azure Data Lake Storage Gen2, you can refer to the following resources: - Lake databases in Azure Synapse Analytics - Managed tables in Azure Synapse Analytics - Data Lake Storage Gen2 security features - Blob storage and Azure Data Lake Gen2 output from Azure Stream Analytics
By following these practices and utilizing the provided resources, you can ensure that your data is securely encrypted when writing to tables or Parquet files in Azure environments.
Secure, monitor, and optimize data storage and data processing (30–35%)
Implement data security
Manage Sensitive Information
Managing sensitive information is a critical aspect of data governance, particularly as data volumes grow and become more complex. Sensitive information can include personal identifiers such as social security numbers, credit card numbers, or other types of personal data. Proper management of this information is essential to comply with security policies, government regulations, and customer privacy expectations.
Understanding Sensitive Data
To effectively manage sensitive information, it is important to understand which data sources contain this type of information. Knowing where sensitive data resides within your organization is the first step in applying the necessary protections and controlling access to it https://learn.microsoft.com/en-us/training/modules/intro-to-microsoft-purview/4-when-to-use-microsoft-purview .
Data Governance with Microsoft Purview
Microsoft Purview is a comprehensive data governance service that assists organizations in managing and governing data across on-premises, multicloud, and SaaS environments. Key features of Microsoft Purview that support the management of sensitive information include:
Automated Data Discovery: Microsoft Purview automates the process of discovering data across your data landscape, which is crucial for identifying where sensitive data is stored https://learn.microsoft.com/en-us/training/modules/intro-to-microsoft-purview/2-what-is-microsoft-purview .
Sensitive Data Classification: With Microsoft Purview, you can classify sensitive data automatically. This helps in applying the appropriate governance policies to ensure that sensitive information is adequately protected https://learn.microsoft.com/en-us/training/modules/intro-to-microsoft-purview/2-what-is-microsoft-purview .
End-to-End Data Lineage: Understanding the flow of data, from its origin to its current location, is facilitated by Microsoft Purview’s data lineage capabilities. This transparency is vital for managing sensitive data throughout its lifecycle https://learn.microsoft.com/en-us/training/modules/intro-to-microsoft-purview/2-what-is-microsoft-purview .
Role-Based Access and Management
Microsoft Purview allows for role-based access control, which means you can assign specific roles to users that define their level of access to sensitive data. For example, certain users may be granted the ability to manage the scanning of data into Microsoft Purview but may not have access to the actual content of the data unless they are also in roles such as Data Reader or Data Curator https://learn.microsoft.com/en-us/training/modules/intro-to-microsoft-purview/4-when-to-use-microsoft-purview .
Empowering Data Users
By mapping out the data landscape and classifying sensitive data, Microsoft Purview empowers data users to find and utilize valuable, trustworthy data while ensuring that sensitive information is handled responsibly https://learn.microsoft.com/en-us/training/modules/intro-to-microsoft-purview/1-introduction .
Additional Resources
For more information on managing sensitive information with Microsoft Purview, you can visit the following URLs:
- Overview of Microsoft Purview: Microsoft Purview Overview
- Data Governance with Microsoft Purview: Microsoft Purview Data Governance
Please note that these URLs are provided for additional context and should be accessed to gain a deeper understanding of the topics discussed.
By implementing these practices and utilizing tools like Microsoft Purview, organizations can ensure that sensitive information is managed effectively, maintaining compliance and protecting against unauthorized access.
Secure, monitor, and optimize data storage and data processing (30–35%)
Monitor data storage and data processing
Implementing logging used by Azure Monitor involves the collection and analysis of telemetry data from various Azure services. Azure Monitor collects data in the form of logs and metrics that provide insights into the performance and availability of applications and services. Here’s a detailed explanation of how to implement logging with Azure Monitor:
Step 1: Enable Diagnostic Settings
To begin collecting logs, you must enable diagnostic settings for each Azure resource. This can be done in the Azure portal, where you can specify the categories of logs to be collected and the destination for the logs. The destinations can include Azure Monitor Logs (Log Analytics workspace), Event Hubs, or Azure Storage.
Step 2: Configure Log Analytics Workspace
A Log Analytics workspace is a unique environment for Azure Monitor log data. Each workspace has its own data repository and configuration. Data collected by Azure Monitor from different sources can be consolidated into a single workspace for analysis.
Step 3: Use Azure Monitor Logs
Azure Monitor Logs is a feature that collects and organizes log and performance data from monitored resources. Logs can be analyzed using the Kusto Query Language (KQL), which allows for complex analytical queries to be performed on large volumes of data.
Step 4: Set Up Alerts
Alerts in Azure Monitor proactively notify you of critical conditions and potentially take automated actions based on triggers from logs. You can set up alerts based on metrics or log query results.
Step 5: Integrate with Azure Monitor Application Insights
For application-level telemetry, integrate Azure Monitor with Application Insights. This service provides deeper insights into your application’s operations and diagnoses errors without affecting the user experience.
Step 6: Monitor Service Health
Azure Service Health provides personalized alerts and guidance when Azure service issues affect you. It can be configured to send alerts about service issues, planned maintenance, and health advisories.
Additional Resources
- For more information on Azure Monitor and how to configure it, visit the Azure Monitor documentation.
- To learn about creating and managing alerts in Azure Monitor, refer to the Alerts in Azure Monitor page.
- For details on analyzing logs with Azure Monitor Logs, check out the Analyze logs in Azure Monitor section.
- To understand how to set up a Log Analytics workspace, you can follow the guide on Create a Log Analytics workspace in the Azure portal.
By following these steps and utilizing the provided resources, you can effectively implement logging with Azure Monitor to gain insights into your Azure resources and applications.
Secure, monitor, and optimize data storage and data processing (30–35%)
Monitor data storage and data processing
Configure Monitoring Services
Monitoring services in Azure are essential for maintaining the health, performance, and reliability of data solutions. When configuring monitoring services, it is important to consider the following aspects:
- Data Pipelines Monitoring:
- Utilize Azure Synapse Analytics to monitor data pipelines. Define datasets to represent the schema of data objects and use linked services to connect to data sources https://learn.microsoft.com/en-us/training/modules/build-data-pipeline-azure-synapse-analytics/2-understand-pipelines-azure-synapse-analytics .
- Ensure that datasets, which can be inputs or outputs for activities in a pipeline, are properly configured at the workspace level and can be shared across multiple pipelines https://learn.microsoft.com/en-us/training/modules/build-data-pipeline-azure-synapse-analytics/2-understand-pipelines-azure-synapse-analytics .
- Stream Processing Monitoring:
- For stream processing solutions, leverage Spark Structured Streaming within Azure Synapse Analytics. Monitor the continuous data flow from sources, through processing, and to sinks https://learn.microsoft.com/en-us/training/modules/use-delta-lake-azure-synapse-analytics/5-use-delta-lake-streaming-data .
- Spark Structured Streaming allows reading from various streaming sources such as Azure Event Hubs, Kafka, or file systems, and it is crucial to monitor these integrations for any issues https://learn.microsoft.com/en-us/training/modules/use-delta-lake-azure-synapse-analytics/5-use-delta-lake-streaming-data .
- Hybrid Transactional/Analytical Processing (HTAP):
- Configure monitoring for Azure Synapse Analytics Link for Cosmos DB to ensure the HTAP integration is functioning correctly, allowing for near-real-time analysis of operational data without complex ETL pipelines https://learn.microsoft.com/en-us/training/modules/configure-azure-synapse-link-with-azure-cosmos-db/1-introduction .
- Big Data Workloads Monitoring:
- Azure Data Lake Storage Gen 2 should be monitored for big data scenarios involving large volumes of diverse data processed at high velocity https://learn.microsoft.com/en-us/training/modules/introduction-to-azure-data-lake-storage/6-use-cases .
- Ensure that the distributed nature of storage and compute resources is leveraged for parallel processing, which is key for high-performance and scalability https://learn.microsoft.com/en-us/training/modules/introduction-to-azure-data-lake-storage/6-use-cases .
For additional information on configuring and monitoring these services, refer to the following resources:
- For datasets and linked services in Azure Synapse Analytics: Datasets in Azure Synapse Analytics
- For Spark Structured Streaming: Structured Streaming Programming Guide
- For Azure Synapse Analytics Link for Cosmos DB: Azure Synapse Link for Azure Cosmos DB
- For Azure Data Lake Storage Gen 2: Introduction to Azure Data Lake Storage Gen2
By carefully configuring and monitoring these services, you can ensure that your data solutions are robust, efficient, and capable of handling the demands of modern data workloads.
Secure, monitor, and optimize data storage and data processing (30–35%)
Monitor data storage and data processing
Monitor Stream Processing
Monitoring stream processing is a critical aspect of managing real-time data analytics. It involves overseeing the continuous flow of data from various sources, ensuring that the data is processed accurately and efficiently, and that the results are delivered to the appropriate destinations.
Azure Stream Analytics is a cloud-based service that provides the capabilities required for monitoring stream processing. It allows you to filter, aggregate, and process real-time streams of data from connected applications, IoT devices, sensors, and other sources. The processed data can then be used to trigger automated activities, generate real-time visualizations, or be integrated into an enterprise analytics solution https://learn.microsoft.com/en-us/training/modules/introduction-to-data-streaming/1-introduction .
Key Components for Monitoring:
Inputs and Outputs: Every Azure Stream Analytics job must have at least one input and one output. Inputs are the sources of streaming data, which can also include static reference data to augment the streamed event data. Outputs are where the results of the stream processing query are sent, such as Azure Data Lake Storage Gen2 containers or tables in a dedicated SQL pool database https://learn.microsoft.com/en-us/training/modules/ingest-streaming-data-use-azure-stream-analytics-synapse/3-configure-inputs-outputs .
Stream Analytics Query: The stream processing logic is encapsulated in a query defined using SQL statements. These queries select data fields from one or more inputs, filter or aggregate the data, and write the results into an output. An example of such a query could be filtering events based on temperature values and writing the results to a specific output https://learn.microsoft.com/en-us/training/modules/introduction-to-data-streaming/3-event-processing .
Event Processing and Delivery Guarantees: Azure Stream Analytics ensures exactly once event processing and at-least-once event delivery. This means that events are never lost, and there are built-in recovery capabilities in case the delivery of an event fails. The service also provides built-in checkpointing to maintain the state of your job and produce repeatable results https://learn.microsoft.com/en-us/training/modules/introduction-to-data-streaming/3-event-processing .
Integration with Sources and Destinations: Azure Stream Analytics has built-in integration with various sources and destinations, offering a flexible programmability model. Inputs for streaming data can include Azure Event Hubs, Azure IoT Hubs, and Azure Blob or Data Lake Gen 2 Storage https://learn.microsoft.com/en-us/training/modules/visualize-real-time-data-azure-stream-analytics-power-bi/2-power-bi-output .
Performance: The Stream Analytics engine enables in-memory compute, offering high performance for processing streaming data https://learn.microsoft.com/en-us/training/modules/introduction-to-data-streaming/3-event-processing .
Monitoring Tools and Techniques:
Azure Portal: The Azure Portal provides a user interface for monitoring the performance and health of your Stream Analytics jobs. It includes metrics such as SU% Utilization, Watermark Delay, and Out of Order Events.
Azure Metrics: Azure Metrics allows you to monitor, alert, and diagnose issues with your Stream Analytics jobs using a set of system-defined metrics.
Azure Log Analytics: You can use Azure Log Analytics to write complex queries against the logs collected from your Stream Analytics jobs to gain deeper insights.
Azure Monitor: Azure Monitor collects and analyzes performance metrics and logs, including those from Azure Stream Analytics, to provide a comprehensive solution for collecting, analyzing, and acting on telemetry from your cloud and on-premises environments.
For more information on monitoring Azure Stream Analytics, you can refer to the following URL: Monitor Azure Stream Analytics jobs.
By effectively monitoring stream processing, organizations can ensure that their real-time data analytics operations are running smoothly, efficiently, and reliably.
Secure, monitor, and optimize data storage and data processing (30–35%)
Monitor data storage and data processing
Measure Performance of Data Movement
When evaluating the performance of data movement within Azure Synapse Analytics, it is essential to understand the role of pipelines. Pipelines are a key component that encapsulate a sequence of activities for data movement and processing tasks https://learn.microsoft.com/en-us/training/modules/build-data-pipeline-azure-synapse-analytics/2-understand-pipelines-azure-synapse-analytics . These activities can include data transfer and transformation, orchestrated through control flow activities that manage branching, looping, and other typical processing logic https://learn.microsoft.com/en-us/training/modules/build-data-pipeline-azure-synapse-analytics/2-understand-pipelines-azure-synapse-analytics .
To measure the performance of data movement, one should consider the following aspects:
Pipeline Efficiency: The graphical design tools in Azure Synapse Studio allow for the construction of complex pipelines with minimal coding https://learn.microsoft.com/en-us/training/modules/build-data-pipeline-azure-synapse-analytics/2-understand-pipelines-azure-synapse-analytics . The efficiency of these pipelines can be measured by how well they perform the intended data movement and transformation tasks.
Data Partitioning: Partitioning is a technique used to optimize performance across worker nodes in Azure https://learn.microsoft.com/en-us/training/modules/transform-data-spark-azure-synapse-analytics/3-partition-data . By partitioning data, performance gains can be achieved, especially when filtering data in queries, as it helps to eliminate unnecessary disk I/O https://learn.microsoft.com/en-us/training/modules/transform-data-spark-azure-synapse-analytics/3-partition-data .
ETL Workloads: The automation of Extract, Transform, and Load (ETL) workloads is a regular process in enterprise analytical solutions https://learn.microsoft.com/en-us/training/modules/build-data-pipeline-azure-synapse-analytics/1-introduction . The performance of these workloads can be measured by the effectiveness and timeliness of the data movement between various data stores in Azure https://learn.microsoft.com/en-us/training/modules/build-data-pipeline-azure-synapse-analytics/1-introduction .
Data Lake Utilization: Azure Data Lake Storage is designed for high-performance analytics and is a critical component in measuring data movement performance https://learn.microsoft.com/en-us/training/modules/introduction-to-azure-data-lake-storage/2-azure-data-lake-gen2 . It combines a file system with a storage platform, optimizing it specifically for analytics workloads https://learn.microsoft.com/en-us/training/modules/introduction-to-azure-data-lake-storage/2-azure-data-lake-gen2 .
For additional information on Azure Synapse Analytics pipelines and their performance, you can refer to the following resources:
Data integration in Azure Synapse Analytics versus Azure Data Factory https://learn.microsoft.com/en-us/training/modules/build-data-pipeline-azure-synapse-analytics/1-introduction .
Introduction to Azure Data Lake Storage https://learn.microsoft.com/en-us/training/modules/introduction-to-azure-data-lake-storage/2-azure-data-lake-gen2 .
By considering these aspects and utilizing the provided resources, one can effectively measure and optimize the performance of data movement within Azure Synapse Analytics.
Secure, monitor, and optimize data storage and data processing (30–35%)
Monitor data storage and data processing
Monitoring and Updating Statistics about Data Across a System
Monitoring and updating statistics about data is a critical task for maintaining the performance and efficiency of a data system. Statistics provide essential information about data distributions and patterns, which the query optimizer uses to determine the most efficient execution plans for queries.
Monitoring Data Statistics
Data Distribution and Usage Patterns: Understanding how data is distributed across tables and how it is accessed can help in identifying performance bottlenecks and optimizing query performance.
Query Performance Metrics: Monitoring metrics such as query execution time, resource utilization, and throughput can indicate how well the system is performing and whether the statistics are up to date.
Automatic Updates: Many systems have mechanisms to automatically update statistics when significant data changes occur. Monitoring these updates ensures that the statistics reflect the current state of the data.
Custom Monitoring Solutions: In some cases, custom monitoring solutions may be necessary to track specific metrics or to integrate with other monitoring tools.
Updating Data Statistics
Manual Updates: Depending on the system, database administrators may need to manually update statistics to ensure they accurately reflect the data, especially after large data loads or significant changes.
Scheduled Updates: Setting up scheduled updates can help maintain statistics without manual intervention, ensuring that the optimizer has the information it needs to make decisions.
Impact Analysis: Before updating statistics, it’s important to analyze the potential impact on query performance and system resources to avoid negative effects during peak usage times.
Best Practices: Following best practices for statistics updates, such as updating during off-peak hours and using sampling to reduce resource usage, can help maintain system performance.
For additional information on monitoring and updating statistics, you can refer to the following resources:
- Massively parallel processing (MPP) architecture and its impact on data distribution and statistics https://learn.microsoft.com/en-us/training/modules/design-multidimensional-schema-to-optimize-analytical-workloads/3-create-tables .
- Serverless SQL pool in Azure Synapse Analytics for querying data and understanding cost implications for each query https://learn.microsoft.com/en-us/training/modules/query-data-lake-using-azure-synapse-serverless-sql-pools/2-understand-serverless-pools .
- Data Lake Storage and its compatibility with Hadoop Distributed File System (HDFS) for storing and accessing data https://learn.microsoft.com/en-us/training/modules/introduction-to-azure-data-lake-storage/2-azure-data-lake-gen2 .
- Loading data into a relational data warehouse and the importance of post-load optimization https://learn.microsoft.com/en-us/training/modules/design-multidimensional-schema-to-optimize-analytical-workloads/4-load-data .
- Delta Lake and its support for CRUD operations in a table format https://learn.microsoft.com/en-us/training/modules/use-delta-lake-azure-synapse-analytics/2-understand-delta-lake .
Please note that the URLs provided are for reference purposes and should be accessed for more detailed information on the respective topics.
Secure, monitor, and optimize data storage and data processing (30–35%)
Monitor data storage and data processing
Monitoring Data Pipeline Performance in Azure Synapse Analytics
Monitoring the performance of data pipelines is a critical aspect of managing data integration and data flow activities within Azure Synapse Analytics. Azure Synapse provides a comprehensive monitoring interface that allows data engineers to track the performance and health of their pipelines.
Key Features for Monitoring Pipelines:
Pipeline Runs Monitoring: Azure Synapse Studio’s Monitor page offers visibility into each individual run of a pipeline. This feature is essential for troubleshooting and understanding the performance of data pipelines over time https://learn.microsoft.com/en-us/training/modules/build-data-pipeline-azure-synapse-analytics/5-run-pipelines .
Event-based Triggers: Pipelines can be configured to run based on specific events, such as the addition of new data files to a folder in a data lake. This allows for real-time monitoring and response to changes in the data environment https://learn.microsoft.com/en-us/training/modules/build-data-pipeline-azure-synapse-analytics/5-run-pipelines .
Scheduled Triggers: Pipelines can also be set to run at explicitly scheduled intervals, ensuring regular data processing and enabling consistent performance monitoring https://learn.microsoft.com/en-us/training/modules/build-data-pipeline-azure-synapse-analytics/5-run-pipelines .
Integration with Microsoft Purview: For a more comprehensive monitoring solution, Azure Synapse Analytics can be integrated with Microsoft Purview. This integration allows for tracking of data lineage and data flows, providing a deeper understanding of the data pipeline’s performance https://learn.microsoft.com/en-us/training/modules/build-data-pipeline-azure-synapse-analytics/5-run-pipelines .
Best Practices for Efficient Pipeline Performance:
Optimize Spark Notebooks: When using Apache Spark pools within Azure Synapse Analytics, it is recommended to optimize Spark notebooks for maintainability and performance. This includes organizing code, caching intermediate results, and avoiding unnecessary computations https://learn.microsoft.com/en-us/training/modules/use-spark-notebooks-azure-synapse-pipeline/2-understand-notebooks-pipelines .
Use of Datasets: Datasets define the schema for data objects used in the pipeline and are associated with a linked service for source connection. Efficient use of datasets can improve the performance of pipeline activities https://learn.microsoft.com/en-us/training/modules/build-data-pipeline-azure-synapse-analytics/2-understand-pipelines-azure-synapse-analytics .
Partitioning Data: Implementing partitioning as an optimization technique can significantly enhance performance by reducing unnecessary disk I/O and maximizing the efficiency of worker nodes https://learn.microsoft.com/en-us/training/modules/transform-data-spark-azure-synapse-analytics/3-partition-data .
Automate ETL Workloads: Automating extract, transform, and load (ETL) processes as part of a regular enterprise analytical solution can streamline data movement and improve overall pipeline performance https://learn.microsoft.com/en-us/training/modules/build-data-pipeline-azure-synapse-analytics/1-introduction .
Additional Resources:
For more information on monitoring data pipelines and optimizing performance in Azure Synapse Analytics, the following resources may be helpful:
- Monitor Pipelines in Azure Synapse Analytics https://learn.microsoft.com/en-us/training/modules/build-data-pipeline-azure-synapse-analytics/5-run-pipelines
- Integrate Microsoft Purview and Azure Synapse Analytics https://learn.microsoft.com/en-us/training/modules/build-data-pipeline-azure-synapse-analytics/5-run-pipelines
- Use Spark Notebooks in Azure Synapse Pipeline https://learn.microsoft.com/en-us/training/modules/use-spark-notebooks-azure-synapse-pipeline/2-understand-notebooks-pipelines
- Data Integration in Azure Synapse Analytics versus Azure Data Factory https://learn.microsoft.com/en-us/training/modules/build-data-pipeline-azure-synapse-analytics/1-introduction
By following these guidelines and utilizing the available resources, data engineers can effectively monitor and enhance the performance of their data pipelines within Azure Synapse Analytics.
Secure, monitor, and optimize data storage and data processing (30–35%)
Monitor data storage and data processing
Measure Query Performance
When measuring query performance in data analytics, it is essential to consider various factors that can impact the speed and efficiency of data retrieval and processing. Here are some key points to consider:
- Serverless SQL Pool in Azure Synapse Analytics:
- Utilize serverless SQL pools for querying data without the need to reserve resources or manage infrastructure. This pay-per-query model allows you to query data directly from your data lake using familiar Transact-SQL syntax, which can lead to cost savings and ease of use https://learn.microsoft.com/en-us/training/modules/query-data-lake-using-azure-synapse-serverless-sql-pools/2-understand-serverless-pools .
- Serverless SQL pools are designed for large-scale data and distributed query processing, which results in fast query performance. They also have built-in fault tolerance for high reliability, especially with long-running queries https://learn.microsoft.com/en-us/training/modules/query-data-lake-using-azure-synapse-serverless-sql-pools/2-understand-serverless-pools .
- For additional information on serverless SQL pools, visit: Use Azure Synapse serverless SQL pool to query files in a data lake https://learn.microsoft.com/en-us/training/modules/ingest-streaming-data-use-azure-stream-analytics-synapse/5-run-job-ingest .
- Partitioning in Spark:
- Partitioning is a performance optimization technique in Spark that can improve query performance by maximizing the use of worker nodes and reducing unnecessary disk I/O https://learn.microsoft.com/en-us/training/modules/transform-data-spark-azure-synapse-analytics/3-partition-data .
- When filtering data in queries, partitioning can lead to more performance gains by only processing the relevant partitions of data https://learn.microsoft.com/en-us/training/modules/transform-data-spark-azure-synapse-analytics/3-partition-data .
- Azure Data Lake Storage:
- Azure Data Lake Storage is optimized for analytics workloads, providing a scalable and secure data lake solution. It is built on Azure Blob storage, enhancing analytics performance and offering data lifecycle management capabilities https://learn.microsoft.com/en-us/training/modules/introduction-to-azure-data-lake-storage/2-azure-data-lake-gen2 .
- For more information on Azure Data Lake Storage, refer to: Introduction to Azure Data Lake Storage https://learn.microsoft.com/en-us/training/modules/introduction-to-azure-data-lake-storage/2-azure-data-lake-gen2 .
- Indexing in Azure Synapse Analytics:
- Azure Synapse Analytics dedicated SQL pools support clustered columnstore indexes by default, which are optimized for querying large data volumes in a data warehouse schema https://learn.microsoft.com/en-us/training/modules/design-multidimensional-schema-to-optimize-analytical-workloads/3-create-tables .
- Clustered columnstore indexes offer significant performance advantages, but if certain data types are not supported, a clustered index can be used instead https://learn.microsoft.com/en-us/training/modules/design-multidimensional-schema-to-optimize-analytical-workloads/3-create-tables .
- For a deeper understanding of indexing in Azure Synapse Analytics, visit: Indexes on dedicated SQL pool tables in Azure Synapse Analytics https://learn.microsoft.com/en-us/training/modules/design-multidimensional-schema-to-optimize-analytical-workloads/3-create-tables .
- Querying Data Lakes:
- Serverless SQL pools can be used to query files in a data lake, such
as querying Parquet files using the
OPENROWSETfunction https://learn.microsoft.com/en-us/training/modules/ingest-streaming-data-use-azure-stream-analytics-synapse/5-run-job-ingest . - Apache Spark pools can also be used to query data lakes, providing code-based querying capabilities with tools like PySpark https://learn.microsoft.com/en-us/training/modules/ingest-streaming-data-use-azure-stream-analytics-synapse/5-run-job-ingest .
- For guidance on querying data lakes with Apache Spark, see: Analyze data with Apache Spark in Azure Synapse Analytics https://learn.microsoft.com/en-us/training/modules/ingest-streaming-data-use-azure-stream-analytics-synapse/5-run-job-ingest .
- Serverless SQL pools can be used to query files in a data lake, such
as querying Parquet files using the
By considering these aspects, you can effectively measure and optimize query performance in your data analytics environment.
Secure, monitor, and optimize data storage and data processing (30–35%)
Monitor data storage and data processing
Schedule and Monitor Pipeline Tests
When working with data integration processes, it is essential to ensure that the pipelines are functioning correctly and efficiently. Scheduling and monitoring pipeline tests are critical steps in this process. Here’s a detailed explanation of how to schedule and monitor pipeline tests within Azure Synapse Analytics:
Scheduling Pipeline Tests
Publishing Pipelines: Before scheduling, you need to publish your pipeline. This step involves finalizing the pipeline’s design and ensuring it is ready for execution.
Creating Triggers: Triggers are responsible for initiating the pipeline run. They can be set up to execute:
- Immediately upon activation.
- At pre-defined intervals, following a schedule.
- In response to an event, such as the arrival of new data files in a data lake https://learn.microsoft.com/en-us/training/modules/build-data-pipeline-azure-synapse-analytics/5-run-pipelines .
Configuring Triggers: When setting up triggers, you can specify the exact conditions under which the pipeline should run. This includes setting up schedules or defining the events that should start the pipeline execution.
Monitoring Pipeline Tests
Using Azure Synapse Studio: Azure Synapse Studio provides a Monitor page where you can observe each pipeline run. This tool is essential for tracking the status of pipeline executions and for troubleshooting any issues that may arise https://learn.microsoft.com/en-us/training/modules/build-data-pipeline-azure-synapse-analytics/5-run-pipelines .
Reviewing Run History: The pipeline run history is a valuable resource for understanding past executions. It can help identify patterns or recurring issues and is useful for auditing and compliance purposes.
Integrating with Microsoft Purview: For a more comprehensive monitoring experience, Azure Synapse Analytics can be integrated with Microsoft Purview. This integration allows you to track data lineage and understand how data flows through your pipelines https://learn.microsoft.com/en-us/training/modules/build-data-pipeline-azure-synapse-analytics/5-run-pipelines .
Best Practices for Pipeline Tests
- Keep Code Organized: Use clear naming conventions and organize code into reusable segments to make maintenance and debugging easier https://learn.microsoft.com/en-us/training/modules/use-spark-notebooks-azure-synapse-pipeline/2-understand-notebooks-pipelines .
- Cache Intermediate Results: Caching can improve the performance of your pipelines by avoiding redundant computations https://learn.microsoft.com/en-us/training/modules/use-spark-notebooks-azure-synapse-pipeline/2-understand-notebooks-pipelines .
- Optimize Computations: Be mindful of the operations you perform and eliminate unnecessary steps to enhance efficiency https://learn.microsoft.com/en-us/training/modules/use-spark-notebooks-azure-synapse-pipeline/2-understand-notebooks-pipelines .
- Use Spark UI: For pipelines involving Spark pools, utilize the Spark UI to monitor job performance and debug issues https://learn.microsoft.com/en-us/training/modules/use-spark-notebooks-azure-synapse-pipeline/2-understand-notebooks-pipelines .
Additional Resources
- For more information on integrating Azure Synapse Analytics with Microsoft Purview, you can visit the following module: Integrate Microsoft Purview and Azure Synapse Analytics https://learn.microsoft.com/en-us/training/modules/build-data-pipeline-azure-synapse-analytics/5-run-pipelines .
By following these guidelines and utilizing the tools provided by Azure Synapse Analytics, you can effectively schedule and monitor your pipeline tests to ensure reliable and efficient data integration processes.
Secure, monitor, and optimize data storage and data processing (30–35%)
Monitor data storage and data processing
Interpretation of Azure Monitor Metrics and Logs
Azure Monitor is a comprehensive solution for collecting, analyzing, and acting on telemetry from your cloud and on-premises environments. It helps you understand how your applications are performing and proactively identifies issues affecting them and the resources they depend on.
Metrics in Azure Monitor are numerical values that describe some aspect of a system at a particular point in time. They are lightweight and capable of supporting near real-time scenarios, making them particularly useful for alerting and fast detection of issues. You can analyze metrics using features such as:
- Charts: Visualize the data in the Azure portal with customizable charts.
- Alerts: Set up alerts to notify you when a metric crosses a threshold.
- Workbooks: Combine text, analytics queries, metrics, and parameters into rich interactive reports.
Logs in Azure Monitor contain different kinds of data organized into records with different sets of properties for each type. Logs are used for complex analysis and can be analyzed with powerful querying and aggregation capabilities of the Kusto Query Language (KQL). Key features include:
- Log Analytics: Write complex queries against your logs to retrieve detailed and specific information.
- Alerts: Create alert rules that automatically run these queries at regular intervals and take action based on the results.
- Dashboards: Combine log data with other data types in Azure dashboards.
To interpret Azure Monitor metrics and logs effectively, you should:
- Understand the data: Know what data is collected by Azure Monitor and how it’s structured.
- Write effective queries: Use KQL to filter, sort, and aggregate log data to extract meaningful insights.
- Visualize the data: Use Azure Monitor’s visualization tools to create charts and dashboards that make the data easy to understand at a glance.
- Set up alerts: Configure alerts to notify you of potential issues before they affect users.
- Integrate with other services: Use Azure Monitor’s integration with services like Azure Logic Apps or Microsoft Power Automate to automate responses to monitoring data.
For additional information on Azure Monitor metrics and logs, you can refer to the following URLs:
- Azure Monitor Metrics: Azure Monitor Metrics Overview
- Azure Monitor Logs: Azure Monitor Logs Overview
- Kusto Query Language (KQL): KQL Overview
Please note that the URLs provided are for reference purposes and are part of the study materials for understanding Azure Monitor within the context of Azure data engineering concepts.
Secure, monitor, and optimize data storage and data processing (30–35%)
Monitor data storage and data processing
Implementing a Pipeline Alert Strategy in Azure Synapse Analytics
When designing a data integration solution in Azure Synapse Analytics, it is crucial to implement a robust pipeline alert strategy. This ensures that you are promptly notified of the status and health of your data pipelines, allowing for quick intervention when necessary. Here’s how you can set up an effective alert strategy:
Monitoring Pipelines: Utilize the monitoring features in Azure Synapse Studio to keep track of pipeline runs. You can view the status of each pipeline activity and diagnose failures if they occur.
Alerts on Activity Failures: Configure alerts to notify you when an activity in a pipeline fails. This can be done by setting up Azure Monitor alerts, which can send notifications via email, SMS, or push to the Azure mobile app.
Dependency Conditions: Use dependency conditions such as Succeeded, Failed, and Completed to manage the control flow of activities within your pipelines. These conditions help in determining the execution path in case of activity failures https://learn.microsoft.com/en-us/training/modules/build-data-pipeline-azure-synapse-analytics/3-create-pipeline-azure-synapse-studio .
Datasets and Linked Services: Ensure that datasets and linked services are correctly configured, as they are essential for the activities within the pipeline to execute successfully. Datasets define the schema and data objects used, while linked services connect to the data sources https://learn.microsoft.com/en-us/training/modules/build-data-pipeline-azure-synapse-analytics/2-understand-pipelines-azure-synapse-analytics .
Automated Retries: Set up automated retries for transient failures. This can be configured in the properties of each activity within the pipeline.
Pipeline Annotations: Use annotations to add metadata to your pipelines, which can be useful for categorizing and filtering pipelines for monitoring and alerting purposes.
Log Analytics: Integrate with Azure Log Analytics for a more comprehensive monitoring solution. Send your pipeline logs to Log Analytics to create custom queries and alerts based on the metrics and logs.
Documentation and Resources: Always refer to the official documentation for the most up-to-date information on configuring alerts and monitoring pipelines. For additional information on data integration in Azure Synapse Analytics and the differences between Azure Synapse Analytics pipelines and Azure Data Factory, visit Data integration in Azure Synapse Analytics versus Azure Data Factory https://learn.microsoft.com/en-us/training/modules/build-data-pipeline-azure-synapse-analytics/1-introduction .
By following these steps, you can create a pipeline alert strategy that enhances the reliability and maintainability of your data integration processes in Azure Synapse Analytics. Remember to review and update your alert strategy regularly to adapt to changes in your data integration requirements and infrastructure.
Secure, monitor, and optimize data storage and data processing (30–35%)
Optimize and troubleshoot data storage and data processing
Compact Small Files
When working with data lakes and analytics services like Azure Synapse Analytics, it’s common to encounter a large number of small files. This can happen due to frequent data ingestion from various sources, where each ingestion creates a new file. Having a multitude of small files can lead to inefficiencies because opening and reading many small files can be more resource-intensive than reading fewer, larger files. This is due to the overhead associated with each file read operation.
To address this issue, a process known as “compacting small files” is often employed. This process involves combining multiple small files into fewer larger ones, which can improve performance by reducing the number of read operations required to process the same amount of data.
Benefits of Compacting Small Files
- Improved Performance: Fewer files mean fewer read operations, which can significantly improve the performance of data processing tasks.
- Optimized Storage: Compacting files can lead to more efficient use of storage, as it reduces the storage overhead associated with maintaining metadata for a large number of files.
- Better Scalability: With fewer files to manage, the system can scale more effectively to handle larger datasets without a corresponding increase in file management overhead.
How to Compact Small Files in Azure Synapse Analytics
Azure Synapse Analytics provides tools and services that can help with the compaction of small files:
- Spark Pools: You can use Spark pools in Azure Synapse Analytics to run a Spark job that reads multiple small files and writes them out as larger files https://learn.microsoft.com/en-us/training/modules/understand-big-data-engineering-with-apache-spark-azure-synapse-analytics/6-exercise-spark .
- Lake Databases: Lake databases in Azure Synapse Analytics allow you to define a relational schema on top of file-based storage, which can help manage and organize data more effectively, potentially reducing the number of small files https://learn.microsoft.com/en-us/training/modules/create-metadata-objects-azure-synapse-serverless-sql-pools/1-introduction https://learn.microsoft.com/en-us/training/modules/create-metadata-objects-azure-synapse-serverless-sql-pools/2-lake-database .
Best Practices
- Regular Maintenance: Schedule regular jobs to compact small files, especially after large data ingestion events.
- Schema Considerations: When using lake databases, design your schema to minimize the creation of small files https://learn.microsoft.com/en-us/training/modules/create-metadata-objects-azure-synapse-serverless-sql-pools/1-introduction https://learn.microsoft.com/en-us/training/modules/create-metadata-objects-azure-synapse-serverless-sql-pools/2-lake-database .
- Data Modeling: Apply data modeling principles to ensure that the data is organized in a way that naturally reduces the number of small files https://learn.microsoft.com/en-us/training/modules/create-metadata-objects-azure-synapse-serverless-sql-pools/2-lake-database .
For additional information on working with Azure Synapse Analytics and optimizing data storage, you can refer to the following resources:
- Understand Big Data Engineering with Apache Spark in Azure Synapse Analytics
- Best Practices for Using Serverless SQL Pool in Azure Synapse Analytics
- Understand Lake Database Concepts in Azure Synapse Analytics
Please note that the URLs provided are for additional context and learning resources and are not meant to be included as part of the study guide content.
Secure, monitor, and optimize data storage and data processing (30–35%)
Optimize and troubleshoot data storage and data processing
Handling skew in data is an important concept in data engineering and analytics, as it refers to the uneven distribution of data across different partitions or nodes, which can lead to performance issues in distributed systems. Skew can occur when a large portion of data is concentrated in a few partitions, causing some nodes to process much more data than others. This can result in bottlenecks and inefficient resource utilization.
To address skew in data, consider the following strategies:
Partitioning: Choose an appropriate partition key that distributes the data evenly across all partitions. Avoid using keys with a limited number of distinct values or keys that cause certain values to be overrepresented.
Salting: Add a random value to the partition key to distribute the load more evenly. This technique is particularly useful when dealing with a hot partition, which is a partition that receives a disproportionately high amount of read or write operations.
Scaling: Adjust the number of partitions or nodes to better handle the volume of data. This can involve increasing the number of partitions or adding more nodes to the cluster.
Data Sampling: Use data sampling techniques to reduce the volume of data being processed, which can mitigate the impact of skew on performance.
Query Optimization: Optimize queries to minimize the impact of skew. This can include rewriting queries to avoid operations that exacerbate skew or using query hints to influence the execution plan.
For additional information on handling skew in data and other data
engineering practices, refer to the Azure Synapse Analytics
documentation, which provides comprehensive guidance on using the
OPENROWSET function and other tools for managing and
querying data: Azure
Synapse Analytics documentation.
Please note that while the URL provided is for general reference and additional learning, it does not explicitly address data skew but offers insights into data handling techniques that can be applied in the context of skew management.
Secure, monitor, and optimize data storage and data processing (30–35%)
Optimize and troubleshoot data storage and data processing
Handling data spill refers to the management of data that exceeds the capacity of the primary storage location and needs to be accommodated in a secondary storage space. In the context of Azure data services, this could involve strategies to manage data overflow in a secure and efficient manner, ensuring that the system can handle large volumes of data without compromising performance or security.
When dealing with data spill in Azure, it’s important to consider the following aspects:
Data Lake Storage: Azure Data Lake Storage Gen2 is designed to handle a vast variety of data at an exabyte scale, providing high throughput for both real-time and batch solutions https://learn.microsoft.com/en-us/training/modules/introduction-to-azure-data-lake-storage/2-azure-data-lake-gen2 . It is a scalable and secure data lake that allows for the storage of large volumes of data, which can be particularly useful when primary storage systems reach their capacity.
Azure Synapse Analytics: Azure Synapse Analytics allows you to work with streaming data as well as batch-processed data. It can combine data from different sources, which can be helpful when managing data spill by integrating overflow data with existing datasets https://learn.microsoft.com/en-us/training/modules/ingest-streaming-data-use-azure-stream-analytics-synapse/5-run-job-ingest .
Relational Data Warehousing: Understanding how to design schemas, create tables, and load data into a data warehouse is crucial. SQL skills are essential for querying and managing data within a relational data warehouse, which can be part of a strategy to handle data spill by organizing and storing excess data efficiently https://learn.microsoft.com/en-us/training/modules/design-multidimensional-schema-to-optimize-analytical-workloads/8-summary .
Serverless SQL Pools: Azure provides the capability to query data lakes using serverless SQL pools without the need for additional code to access the underlying file storage. This can simplify the process of managing and querying spilled data that has been moved to a data lake https://learn.microsoft.com/en-us/training/modules/create-metadata-objects-azure-synapse-serverless-sql-pools/5-use-lake-database .
Apache Spark in Azure Synapse Analytics: Apache Spark can be used for large-scale data processing and analytics, which is available in Azure Synapse Analytics. Spark pools can be configured to ingest, process, and analyze data spill from a data lake, providing a robust solution for handling large data volumes https://learn.microsoft.com/en-us/training/modules/understand-big-data-engineering-with-apache-spark-azure-synapse-analytics/1-introduction .
For additional information on these topics, you can refer to the following resources:
- Azure Data Lake Storage Gen2 documentation: https://docs.microsoft.com/en-us/azure/storage/blobs/data-lake-storage-introduction https://learn.microsoft.com/en-us/training/modules/introduction-to-azure-data-lake-storage/2-azure-data-lake-gen2 .
- Azure Synapse Analytics documentation: https://docs.microsoft.com/en-us/azure/synapse-analytics/ https://learn.microsoft.com/en-us/training/modules/ingest-streaming-data-use-azure-stream-analytics-synapse/5-run-job-ingest .
- Learn how to design and implement a data warehouse with Azure Synapse Analytics: https://docs.microsoft.com/en-us/learn/modules/design-implement-data-warehouse-synapse-analytics/ https://learn.microsoft.com/en-us/training/modules/design-multidimensional-schema-to-optimize-analytical-workloads/8-summary .
- Querying data lakes with serverless SQL pools in Azure Synapse Analytics: https://docs.microsoft.com/en-us/azure/synapse-analytics/sql/query-data-lake .
- Apache Spark with Azure Synapse Analytics: https://docs.microsoft.com/en-us/azure/synapse-analytics/spark/apache-spark-overview https://learn.microsoft.com/en-us/training/modules/understand-big-data-engineering-with-apache-spark-azure-synapse-analytics/1-introduction .
By understanding and utilizing these Azure services and features, you can effectively handle data spill scenarios, ensuring that your data remains accessible and secure even when it exceeds the primary storage capacity.
Secure, monitor, and optimize data storage and data processing (30–35%)
Optimize and troubleshoot data storage and data processing
Optimize Resource Management
Resource management is a critical aspect of working with Azure Synapse Analytics, as it involves configuring and utilizing the available compute resources efficiently to ensure optimal performance and cost-effectiveness. Here are some strategies to optimize resource management:
Properly Size Compute Resources: It’s essential to select the right size for your compute resources based on the workload requirements. Azure Synapse Analytics allows you to choose from a range of compute options, including on-demand and provisioned resources, to match the scale and performance needs of your data workloads.
Use Azure Synapse Pipelines Efficiently: Azure Synapse Pipelines is a powerful service for data integration and workflow orchestration. To optimize resource usage, structure your pipelines to minimize idle times and ensure that activities are well-coordinated. Utilize external processing resources, such as Apache Spark pools, for specific tasks that require additional compute power https://learn.microsoft.com/en-us/training/modules/use-spark-notebooks-azure-synapse-pipeline/2-understand-notebooks-pipelines .
Monitor and Adjust Performance: Regularly monitor the performance of your Azure Synapse Analytics workloads using tools like Azure Monitor and Azure Application Insights. Adjust compute resources as needed based on the insights gathered from monitoring to avoid over-provisioning and reduce costs https://learn.microsoft.com/en-us/training/modules/implement-synapse-link-for-sql/6-knowledge-check .
Implement Best Practices for Spark Notebooks: When using Spark notebooks for data exploration and transformation, follow best practices such as organizing code efficiently, caching intermediate results, and avoiding unnecessary computations. This can lead to better performance and reduced resource consumption https://learn.microsoft.com/en-us/training/modules/use-spark-notebooks-azure-synapse-pipeline/2-understand-notebooks-pipelines .
Optimize Data Storage: Utilize Azure Data Lake Storage Gen2 containers to store large volumes of data in a cost-effective and scalable manner. Ensure that data is organized and partitioned effectively to improve access patterns and reduce the amount of data processed during queries https://learn.microsoft.com/en-us/training/modules/implement-synapse-link-for-sql/6-knowledge-check .
Leverage HTAP Capabilities: Azure Synapse Analytics offers Hybrid Transactional/Analytical Processing (HTAP) capabilities through Azure Synapse Link services. This allows for low-latency replication of transactional data to an analytical store, enabling real-time analytics without impacting transactional system performance https://learn.microsoft.com/en-us/training/modules/design-hybrid-transactional-analytical-processing-using-azure-synapse-analytics/1-introduction .
Manage Dependencies: Keep dependencies, such as Spark versions and library versions, consistent and up-to-date across your cluster to avoid compatibility issues and leverage the latest performance improvements https://learn.microsoft.com/en-us/training/modules/use-spark-notebooks-azure-synapse-pipeline/2-understand-notebooks-pipelines .
For additional information on optimizing resource management in Azure Synapse Analytics, you can refer to the following resources:
- Azure Synapse Analytics documentation
- Azure Synapse Pipelines documentation
- Azure Data Lake Storage Gen2 documentation
- Azure Synapse Link documentation
By implementing these strategies, you can ensure that your Azure Synapse Analytics environment is optimized for both performance and cost, enabling you to get the most out of your data analytics solutions.
Tuning Queries Using Indexers
When working with large datasets, particularly in a data warehousing environment, query performance is a critical factor. Indexers are one of the tools available to optimize query performance. Here’s how they can be used to tune queries:
Understanding Indexers: An indexer is a data structure that improves the speed of data retrieval operations on a database table at the cost of additional writes and storage space to maintain the index data structure. Indexes can be created using one or more columns of a database table, providing the database engine with a quick way to jump to a record within a table.
Choosing the Right Index: The choice of index depends on the nature of the queries. For queries that involve searching for a specific value, a unique index on the columns being searched can greatly improve performance. For range queries, a clustered index might be more appropriate.
Analyzing Query Patterns: Before implementing an index, analyze the query patterns to identify which columns are frequently used in the
WHEREclause,JOINconditions, or as part of anORDER BYorGROUP BY. These columns are prime candidates for indexing.Balancing Indexes: While indexes can speed up query performance, they also add overhead to the database system because the index must be updated every time the data it references is added, deleted, or updated. Therefore, it’s important to balance the number of indexes against the performance benefit they provide.
Monitoring Performance: After creating an index, monitor the query performance to ensure that it has the desired effect. Use query execution plans to see if the index is being used and to identify any potential bottlenecks.
Maintenance: Over time, as data is modified, indexes can become fragmented. Regular index maintenance, such as rebuilding or reorganizing indexes, can help maintain query performance.
Partitioning: In addition to indexing, partitioning data can also improve query performance. By dividing a table into smaller, more manageable pieces, queries can be directed to the relevant partition only, reducing the amount of data scanned and improving response times .
By carefully implementing and maintaining indexers, you can significantly improve the performance of your queries, ensuring that your data warehousing solution remains efficient and responsive to the needs of your business intelligence and data analysis applications.
Secure, monitor, and optimize data storage and data processing (30–35%)
Optimize and troubleshoot data storage and data processing
Tune Queries by Using Cache
When working with large-scale data processing, query performance is a critical aspect. One effective way to enhance query performance is by utilizing caching mechanisms. Caching can significantly reduce the time it takes to execute queries by storing frequently accessed data in a faster storage medium. Here’s a detailed explanation of how caching can be used to tune queries:
Understanding Caching
Caching is the process of storing copies of data in a cache, or a temporary storage location, so that future requests for that data can be served faster. When a query is executed, the system first checks if the result is available in the cache. If it is, the cached data is returned immediately, bypassing the need to access the slower backend storage. If the data is not in the cache, the query is processed normally, and the result may be stored in the cache for future use.
Benefits of Using Cache
- Reduced Latency: By serving data from the cache, the time taken to retrieve data is significantly reduced, leading to faster query performance.
- Lower Load on Data Sources: Caching reduces the number of direct queries to the data source, which can help in managing and scaling the backend infrastructure.
- Improved Throughput: With faster query responses, more queries can be handled in the same amount of time, improving the overall throughput of the system.
Implementing Query Caching
- Identify Frequently Accessed Data: Determine which data or queries are accessed frequently and are good candidates for caching.
- Choose the Right Caching Strategy: Decide on a caching strategy that fits the workload pattern, such as LRU (Least Recently Used) or LFU (Least Frequently Used).
- Set Appropriate Cache Expiry: Configure the cache to expire data that is stale or no longer needed to ensure that the cache does not serve outdated information.
- Monitor Cache Performance: Continuously monitor the cache hit rate and adjust the caching strategy as needed to maintain optimal performance.
Cache in Azure Synapse Analytics
Azure Synapse Analytics provides a serverless SQL pool that can utilize caching to improve query performance. The serverless SQL pool allows querying data in place without the need to copy or load data into a specialized store. It uses distributed query processing, which is optimized for large-scale data and includes built-in query execution fault-tolerance https://learn.microsoft.com/en-us/training/modules/query-data-lake-using-azure-synapse-serverless-sql-pools/2-understand-serverless-pools .
For additional information on implementing caching strategies and tuning queries in Azure Synapse Analytics, you can refer to the following resources:
By following these guidelines and leveraging the capabilities of Azure Synapse Analytics, you can effectively tune your queries using caching to achieve better performance and efficiency.
Secure, monitor, and optimize data storage and data processing (30–35%)
Optimize and troubleshoot data storage and data processing
Troubleshooting a Failed Spark Job
When dealing with a failed Spark job, it’s important to approach the issue systematically to identify and resolve the underlying problem. Here are steps and best practices to troubleshoot a failed Spark job:
Check Application Logs: The first step in troubleshooting is to examine the application logs. Spark provides detailed logs that can give insights into what went wrong. Look for errors or exceptions in the logs that indicate the cause of the failure.
Spark Web UI: Utilize the Spark web-based user interface (UI) to monitor and debug your Spark jobs. The UI provides detailed information about the execution of tasks, including execution times, input and output data sizes, and stages of the job that may have failed https://learn.microsoft.com/en-us/training/modules/use-spark-notebooks-azure-synapse-pipeline/2-understand-notebooks-pipelines .
Analyze Stack Trace: If an exception is thrown, the stack trace can be a valuable source of information. It can help you pinpoint the exact line of code or transformation that caused the issue.
Resource Allocation: Insufficient resources can often lead to job failures. Ensure that the Spark pool is configured with appropriate compute resources for the workload. Adjust the number of executors, cores, and memory settings if necessary https://learn.microsoft.com/en-us/training/modules/use-spark-notebooks-azure-synapse-pipeline/2-understand-notebooks-pipelines .
Data Skew: Data skew can cause certain tasks to take much longer than others, potentially leading to timeouts or out-of-memory errors. Investigate the data distribution and consider repartitioning the data if skew is detected.
Code Optimization: Review the code for any unnecessary computations or operations. For instance, filtering data early in the transformation process can reduce the amount of data processed in subsequent steps https://learn.microsoft.com/en-us/training/modules/use-spark-notebooks-azure-synapse-pipeline/2-understand-notebooks-pipelines .
Caching: Spark allows you to cache intermediate results. If your job involves iterative computations over the same dataset, caching can help improve performance. However, be mindful of the memory usage when caching large datasets https://learn.microsoft.com/en-us/training/modules/use-spark-notebooks-azure-synapse-pipeline/2-understand-notebooks-pipelines .
Avoid Collecting Large Datasets: Using the
collect()method to bring a large dataset into the driver node can cause memory issues. Instead, perform operations on the distributed dataset and bring only the final aggregated results to the driver if needed https://learn.microsoft.com/en-us/training/modules/use-spark-notebooks-azure-synapse-pipeline/2-understand-notebooks-pipelines .Dependency Management: Ensure that all dependencies are version-consistent across the cluster. Using incompatible versions of libraries can lead to unexpected behavior and job failures https://learn.microsoft.com/en-us/training/modules/use-spark-notebooks-azure-synapse-pipeline/2-understand-notebooks-pipelines .
External Factors: Sometimes, the issue may be due to external factors such as network connectivity problems or issues with the underlying infrastructure. Check for any reported issues with the cloud services or hardware that may affect the Spark job.
For additional information and resources on troubleshooting Spark jobs in Azure Synapse Analytics, you can refer to the following URLs:
- Apache Spark in Azure Synapse Analytics https://learn.microsoft.com/en-us/training/modules/understand-big-data-engineering-with-apache-spark-azure-synapse-analytics/1-introduction .
- Use Spark notebooks in an Azure Synapse Pipeline https://learn.microsoft.com/en-us/training/modules/use-spark-notebooks-azure-synapse-pipeline/2-understand-notebooks-pipelines .
Remember to adapt these troubleshooting steps to the specific context of your Spark job and the environment in which it is running.
Secure, monitor, and optimize data storage and data processing (30–35%)
Optimize and troubleshoot data storage and data processing
Troubleshooting a Failed Pipeline Run in Azure Synapse Analytics
When dealing with a failed pipeline run in Azure Synapse Analytics, it is essential to systematically approach the troubleshooting process. This includes understanding the activities executed within the pipeline, as well as those that depend on external services. Here’s a detailed guide on how to troubleshoot a failed pipeline run:
1. Initial Assessment
Begin by identifying the failure point within the pipeline. You can do this by navigating to the Monitor page in Azure Synapse Studio, where you can view the details of each pipeline run https://learn.microsoft.com/en-us/training/modules/build-data-pipeline-azure-synapse-analytics/5-run-pipelines .
2. Review Activity Failures
Examine the activities that have failed. The pipeline designer in Azure Synapse Studio allows you to see the logical sequence of activities and their dependency conditions, which can help you pinpoint where the failure occurred https://learn.microsoft.com/en-us/training/modules/build-data-pipeline-azure-synapse-analytics/3-create-pipeline-azure-synapse-studio .
3. Check External Service Activities
If the failure is related to an activity that depends on an external service, such as running a notebook in Azure Databricks or calling a stored procedure in Azure SQL Database, ensure that the linked services are correctly defined and that secure connections to these services are established https://learn.microsoft.com/en-us/training/modules/build-data-pipeline-azure-synapse-analytics/2-understand-pipelines-azure-synapse-analytics .
4. Analyze Activity Logs
For each failed activity, review the logs to understand the error messages. This can provide insights into the cause of the failure, such as configuration issues, authentication problems, or resource limitations.
5. Spark Pool Considerations
If the failed activity involves running code in a notebook on an
Apache Spark pool, consider the following best practices: - Ensure that
the Spark pool is configured with the appropriate compute resources for
your workload https://learn.microsoft.com/en-us/training/modules/use-spark-notebooks-azure-synapse-pipeline/2-understand-notebooks-pipelines
. - Organize your code efficiently and use descriptive variable and
function names https://learn.microsoft.com/en-us/training/modules/use-spark-notebooks-azure-synapse-pipeline/2-understand-notebooks-pipelines
. - Cache intermediate results to improve performance https://learn.microsoft.com/en-us/training/modules/use-spark-notebooks-azure-synapse-pipeline/2-understand-notebooks-pipelines
. - Avoid unnecessary computations and the use of the
collect() method on large datasets https://learn.microsoft.com/en-us/training/modules/use-spark-notebooks-azure-synapse-pipeline/2-understand-notebooks-pipelines
. - Utilize the Spark UI for monitoring and debugging https://learn.microsoft.com/en-us/training/modules/use-spark-notebooks-azure-synapse-pipeline/2-understand-notebooks-pipelines
.
6. Pipeline Configuration
Review the pipeline configuration settings in the properties pane for each activity. Ensure that the settings align with the expected behavior and that any external resources are correctly referenced.
7. Linked Services
Verify that the linked services for external activities are properly configured at the Azure Synapse Analytics workspace level. These services should be shared across pipelines and set up to enable secure connections https://learn.microsoft.com/en-us/training/modules/build-data-pipeline-azure-synapse-analytics/2-understand-pipelines-azure-synapse-analytics .
8. External Resources
For activities that use external processing resources, such as an Apache Spark pool, ensure that the code in the notebook is optimized and that the Spark pool has the necessary resources allocated https://learn.microsoft.com/en-us/training/modules/use-spark-notebooks-azure-synapse-pipeline/2-understand-notebooks-pipelines .
9. Event Triggers
If the pipeline is triggered by an event, such as new data files being loaded into a data lake, confirm that the event trigger is set up correctly and that the event conditions are being met https://learn.microsoft.com/en-us/training/modules/build-data-pipeline-azure-synapse-analytics/5-run-pipelines .
10. Additional Resources
For more in-depth guidance, consider the following resources: - Azure Synapse Analytics documentation: Use Spark notebooks in an Azure Synapse Pipeline https://learn.microsoft.com/en-us/training/modules/use-spark-notebooks-azure-synapse-pipeline/2-understand-notebooks-pipelines . - Azure Synapse Studio pipeline designer: Build a data pipeline in Azure Synapse Analytics https://learn.microsoft.com/en-us/training/modules/build-data-pipeline-azure-synapse-analytics/3-create-pipeline-azure-synapse-studio . - Integration between Azure Synapse Analytics and Microsoft Purview: Integrate Microsoft Purview and Azure Synapse Analytics https://learn.microsoft.com/en-us/training/modules/build-data-pipeline-azure-synapse-analytics/5-run-pipelines .
By following these steps and utilizing the provided resources, you can effectively troubleshoot a failed pipeline run in Azure Synapse Analytics, including activities executed in external services.
Secure, monitor, and optimize data storage and data processing (30–35%)
Optimize and troubleshoot data storage and data processing
Troubleshooting a Failed Pipeline Run in Azure Synapse Analytics
When dealing with a failed pipeline run in Azure Synapse Analytics, it is essential to systematically approach the troubleshooting process. This includes understanding the activities executed within the pipeline, as well as those that depend on external services. Here’s a detailed explanation of the steps you should take to troubleshoot a failed pipeline run:
Identify the Failed Activity: Begin by identifying which activity within the pipeline has failed. You can do this by navigating to the Monitor page in Azure Synapse Studio, where you can view the status of each pipeline run https://learn.microsoft.com/en-us/training/modules/build-data-pipeline-azure-synapse-analytics/5-run-pipelines .
Review Activity Details: Once you have identified the failed activity, select it to review the details. This will provide you with specific error messages and other diagnostic information that can help you understand the cause of the failure.
Check External Services: If the failed activity involves an external service, such as running a notebook in Azure Databricks or calling a stored procedure in Azure SQL Database, ensure that the linked services are correctly defined and that secure connections to these services are established https://learn.microsoft.com/en-us/training/modules/build-data-pipeline-azure-synapse-analytics/2-understand-pipelines-azure-synapse-analytics .
Analyze Dependency Conditions: Review the dependency conditions like Succeeded, Failed, and Completed that connect the activities in your pipeline. These conditions determine the logical sequence of activities and can impact the execution flow https://learn.microsoft.com/en-us/training/modules/build-data-pipeline-azure-synapse-analytics/3-create-pipeline-azure-synapse-studio .
Utilize Spark Pool for Notebooks: If the failure is related to a Spark notebook, ensure that the Spark pool is correctly configured with the necessary compute resources and runtime. Also, consider best practices such as caching intermediate results and avoiding unnecessary computations to optimize performance https://learn.microsoft.com/en-us/training/modules/use-spark-notebooks-azure-synapse-pipeline/2-understand-notebooks-pipelines .
Monitor and Debug with Spark UI: For activities running on a Spark pool, use the Spark UI to monitor and debug the performance of your Spark jobs. This web-based interface provides detailed information about task execution times, data sizes, and more https://learn.microsoft.com/en-us/training/modules/use-spark-notebooks-azure-synapse-pipeline/2-understand-notebooks-pipelines .
Apply Best Practices: Implement best practices such as organizing code efficiently, avoiding the use of
collect()unless necessary, and keeping dependencies version-consistent and updated https://learn.microsoft.com/en-us/training/modules/use-spark-notebooks-azure-synapse-pipeline/2-understand-notebooks-pipelines .Consult Documentation: For additional guidance and best practices, refer to the official documentation provided by Microsoft. This can include troubleshooting guides, best practice recommendations, and detailed explanations of pipeline activities and configurations.
For more information on troubleshooting pipelines in Azure Synapse Analytics, you can visit the following URLs: - Monitor pipeline runs in Azure Synapse Studio https://learn.microsoft.com/en-us/training/modules/build-data-pipeline-azure-synapse-analytics/5-run-pipelines - Use Spark notebooks in an Azure Synapse pipeline https://learn.microsoft.com/en-us/training/modules/use-spark-notebooks-azure-synapse-pipeline/2-understand-notebooks-pipelines - Integrate Microsoft Purview and Azure Synapse Analytics https://learn.microsoft.com/en-us/training/modules/build-data-pipeline-azure-synapse-analytics/5-run-pipelines
By following these steps and utilizing the provided resources, you can effectively troubleshoot a failed pipeline run in Azure Synapse Analytics, including activities executed in external services.