AZ-400 Study Guide

Configure processes and communications (10–15%)
Configure activity traceability and flow of work
Plan and Implement a Structure for the Flow of Work and Feedback Cycles
When planning and implementing a structure for the flow of work and feedback cycles, it is essential to establish a clear and efficient process that allows for continuous integration, delivery, and feedback. Below are key considerations and steps to create such a structure:
- Define the Workflow:
- Establish stages of development, such as planning, coding, testing, and deployment.
- Use agile planning tools to manage and track work across the team, as provided by Azure Boards https://learn.microsoft.com/en-us/training/modules/plan-agile-github-projects-azure-boards/9-agile-plan-portfolio-management-azure-boards .
- Continuous Integration and Continuous Deployment
(CI/CD):
- Implement automation tools like GitHub Actions to enable Continuous Integration, allowing developers to merge code changes more frequently https://learn.microsoft.com/en-us/training/modules/introduction-to-github-actions/1-introduction .
- Set up automated deployment pipelines to ensure that code is reliably deployed to production.
- Feedback Loops:
- Create mechanisms for immediate feedback on code commits and build status, such as notifications from CI tools.
- Use sprint and task boards to track the flow of work and gather feedback during iterations https://learn.microsoft.com/en-us/training/modules/plan-agile-github-projects-azure-boards/9-agile-plan-portfolio-management-azure-boards .
- Versioning Strategy:
- Adopt a versioning strategy, such as Semantic Versioning (SemVer 2.0), to manage changes and dependencies effectively https://learn.microsoft.com/en-us/training/modules/implement-versioning-strategy/7-explore-best-practices-for-versioning .
- Document the versioning strategy and ensure it is part of the Definition of Done for related work items https://learn.microsoft.com/en-us/training/modules/implement-versioning-strategy/7-explore-best-practices-for-versioning .
- Security Integration:
- Integrate security practices into the DevOps workflow, ensuring that security checks are part of the CI/CD pipeline.
- Address security concerns throughout the development cycle rather than at the end, to avoid unplanned work and vulnerabilities https://learn.microsoft.com/en-us/training/modules/introduction-to-secure-devops/3-understand-devsecops .
- Automation and Desired State Configuration (DSC):
- Implement DSC to maintain the consistency of configurations across environments https://learn.microsoft.com/en-us/training/modules/implement-desired-state-configuration-dsc/1-introduction .
- Utilize Azure Automation State Configuration for managing DSC in the cloud https://learn.microsoft.com/en-us/training/modules/implement-desired-state-configuration-dsc/1-introduction .
- Hybrid Management Planning:
- Plan for hybrid management if your infrastructure spans on-premises and cloud environments, ensuring seamless workflow and feedback across all platforms https://learn.microsoft.com/en-us/training/modules/implement-desired-state-configuration-dsc/1-introduction .
- Documentation and Best Practices:
- Ensure that all processes and strategies are well-documented.
- Share best practices with the development teams and incorporate them into the workflow https://learn.microsoft.com/en-us/training/modules/implement-versioning-strategy/7-explore-best-practices-for-versioning .
For additional information on best practices for versioning and Azure Artifacts, you can refer to the following resource: Best practices for using Azure Artifacts https://learn.microsoft.com/en-us/training/modules/implement-versioning-strategy/7-explore-best-practices-for-versioning .
By following these steps and considerations, you can plan and implement a structured flow of work and feedback cycles that enhance collaboration, efficiency, and product quality.
Configure processes and communications (10–15%)
Configure activity traceability and flow of work
Identifying Appropriate Metrics for Flow of Work
When managing the flow of work, especially in an Agile environment, it is crucial to measure and understand various metrics that can help teams assess their efficiency and effectiveness. Here are some key metrics that are commonly used:
Cycle Time
Cycle time is the amount of time it takes for a work item to move from the start to the end of a process. It measures the speed at which tasks are completed once work has begun. A shorter cycle time typically indicates a more efficient process. To track cycle time, teams can use task boards and monitor the time each item spends in each stage of the workflow.
Time to Recovery
Time to recovery, also known as mean time to recover (MTTR), refers to the time it takes for a team to recover from a failure or incident. This metric is particularly important in DevOps practices, where the focus is on continuous delivery and reliability. Monitoring time to recovery helps teams understand their responsiveness to issues and their ability to quickly restore service.
Lead Time
Lead time measures the total time taken from the moment a work item is requested until it is fully delivered. It includes both processing time and any waiting periods that occur before the work begins. Lead time provides insight into the overall efficiency of the workflow from request to delivery.
To effectively track these metrics, teams can utilize various tools and services. For instance:
- Azure Boards: Offers agile planning and portfolio management tools that can help track the flow of work during an iteration with product backlogs, sprint backlogs, and task boards https://learn.microsoft.com/en-us/training/modules/plan-agile-github-projects-azure-boards/9-agile-plan-portfolio-management-azure-boards .
- Azure Monitor: Provides performance metrics and dependency tracking to investigate response times and diagnose problems related to the flow of work https://learn.microsoft.com/en-us/training/modules/manage-alerts-blameless-retrospectives-just-culture/5-improve-performance .
- Azure App Configuration: Helps manage application settings and feature flags, which can impact the flow of work by enabling real-time changes to application settings without redeployment https://learn.microsoft.com/en-us/training/modules/manage-application-configuration-data/5-introduction-to-azure-app-configuration .
For more detailed information on these tools and how to implement them, you can refer to the following resources:
- Azure Boards for agile planning and management: Azure Boards documentation
- Azure Monitor for performance metrics and dependency tracking: Azure Monitor documentation
- Azure App Configuration for managing application settings: Azure App Configuration documentation
By understanding and monitoring these metrics, teams can make informed decisions to improve their processes, reduce waste, and deliver value to customers more effectively.
Configure processes and communications (10–15%)
Configure activity traceability and flow of work
Integrating Azure Pipelines and GitHub Actions with work item tracking tools allows for a seamless connection between the code changes and the tasks or bugs they are associated with. This integration helps teams to automate their workflows, track progress, and ensure that changes in the codebase are linked to specific work items.
Azure Pipelines Integration with Work Item Tracking
Azure Pipelines is a continuous integration and continuous delivery (CI/CD) service that can be used to automatically build, test, and deploy code projects. When integrated with work item tracking tools like Azure Boards, it provides the following capabilities:
- Automated Linking: When developers check in code or create pull requests, they can include work item IDs in their commit messages or PR descriptions. Azure Pipelines can then automatically link the changes to the corresponding work items.
- Traceability: This integration allows teams to trace commits and builds back to the work items, providing a clear path from requirement to deployment.
- Status Updates: The status of work items can be automatically updated based on the pipeline’s progress. For example, when a build succeeds and the deployment is completed, the associated work items can be marked as done.
GitHub Actions Integration with Work Item Tracking
GitHub Actions is a CI/CD platform that enables automation of software workflows. Integrating GitHub Actions with work item tracking tools involves:
- Event-Driven Workflows: GitHub Actions can be triggered by various GitHub events such as push, pull requests, or issue comments. These workflows can be configured to interact with work item tracking tools to update work items or create new ones.
- Custom Scripts: Custom scripts can be written in GitHub Actions workflows to interact with the APIs of work item tracking tools, allowing for complex automation and integration scenarios.
- Marketplace Actions: There are actions available in the GitHub Marketplace that are specifically designed to integrate with work item tracking tools, making it easier to set up the integration.
Additional Resources
For more information on integrating Azure Pipelines with Azure Boards, you can visit the following URL: - Azure Boards and Azure Pipelines documentation: Azure Boards with Azure Pipelines
For details on how to use GitHub Actions to automate your workflows and integrate with work item tracking, refer to: - GitHub Actions documentation: Automating your workflow with GitHub Actions
By leveraging these integrations, teams can improve collaboration, streamline their development process, and maintain a high level of transparency throughout the lifecycle of their software projects.
Configure processes and communications (10–15%)
Configure activity traceability and flow of work
Implementing traceability policies is a crucial aspect of managing the software development lifecycle. Traceability policies ensure that every change made to the codebase can be tracked back to its source, which is essential for maintaining code quality, compliance, and facilitating effective troubleshooting and auditing.
To implement traceability policies, one must consider the following steps:
Define Traceability Requirements: Determine what needs to be traceable within the project. This could include code changes, configuration changes, and deployment activities.
Utilize Source Control Management (SCM): Ensure that all code and configuration changes are committed to a version control system like Git. This allows for tracking who made changes, what changes were made, and when they were made.
Integrate Build and Release Pipelines: Use continuous integration (CI) and continuous deployment (CD) tools, such as Azure DevOps or GitHub Actions https://learn.microsoft.com/en-us/training/modules/learn-continuous-integration-github-actions/1-introduction , to automate the build and release process. This integration ensures that every change made in the SCM triggers a build and, if successful, is deployed to the appropriate environment.
Enforce Code Review Policies: Implement mandatory code review policies where changes must be reviewed and approved by one or more peers before being merged into the main branch. This practice not only improves code quality but also adds an additional layer of traceability.
Automate Compliance Checks: Use tools like Azure Policies to enforce organizational standards and compliance requirements automatically. This ensures that all resources are compliant with the defined traceability policies.
Maintain Detailed Logs: Keep detailed logs of all activities, including changes, builds, and deployments. Tools like Microsoft Defender for Cloud can assist in security monitoring and governance https://learn.microsoft.com/en-us/training/modules/security-monitoring-and-governance/1-introduction .
Implement Monitoring and Alerts: Set up monitoring and alerts to notify relevant stakeholders of any changes or issues. This proactive approach helps maintain traceability throughout the project lifecycle.
Document Policies and Procedures: Clearly document all traceability policies and procedures to ensure that they are understood and followed by the development team.
Educate and Train Team Members: Provide training to all team members on the importance of traceability and how to adhere to the policies.
Regular Audits and Reviews: Conduct regular audits and reviews to ensure that traceability policies are being followed and to identify areas for improvement.
For additional information on implementing traceability policies and the tools mentioned, you can refer to the following resources:
- Continuous integration using GitHub Actions: GitHub Actions Documentation
- Security monitoring and governance with Microsoft Defender for Cloud: Microsoft Defender for Cloud Documentation
- Azure Policies for compliance checks: Azure Policies Documentation
By following these steps and utilizing the appropriate tools, organizations can effectively implement traceability policies that support their development processes and compliance requirements.
Configure processes and communications (10–15%)
Configure activity traceability and flow of work
Integrate a Repository with Azure Boards
Integrating a repository with Azure Boards allows teams to track their work efficiently and associate code changes directly with work items. Azure Boards provides a rich set of capabilities for planning, tracking, and discussing work among your team members. When integrated with GitHub repositories, it enables linking GitHub commits, pull requests, and issues to Azure Boards work items, offering full traceability from code to work item.
Setting Up the Integration
The integration between Azure Boards and GitHub is facilitated by the Azure Boards App, which acts as a bridge connecting the two services. To set up the integration:
Install the Azure Boards App: You must be an administrator or owner of the GitHub repository or organization to install the app. The app can be installed from the GitHub Marketplace https://learn.microsoft.com/en-us/training/modules/plan-agile-github-projects-azure-boards/4-link-github-to-azure-boards .
Authenticate the Connection: For GitHub in the cloud, authentication options include using a Username/Password or a Personal Access Token (PAT) https://learn.microsoft.com/en-us/training/modules/plan-agile-github-projects-azure-boards/4-link-github-to-azure-boards .
Configure the Integration: From Azure Boards, you can connect one or more GitHub repositories to an Azure Boards project. You can also add or remove GitHub repositories from a GitHub connection within an Azure Boards project, or completely remove a GitHub connection for a project https://learn.microsoft.com/en-us/training/modules/plan-agile-github-projects-azure-boards/4-link-github-to-azure-boards .
Features of the Integration
- Direct Linking: Create links between work items and GitHub commits, pull requests, and issues based on GitHub mentions https://learn.microsoft.com/en-us/training/modules/plan-agile-github-projects-azure-boards/4-link-github-to-azure-boards .
- State Transition: Support state transition of work items to a Done or Completed state when using GitHub mention by using fix, fixes, or fixed https://learn.microsoft.com/en-us/training/modules/plan-agile-github-projects-azure-boards/4-link-github-to-azure-boards .
- Traceability: Post a discussion comment to GitHub when linking from a work item to a GitHub commit, pull request, or issue https://learn.microsoft.com/en-us/training/modules/plan-agile-github-projects-azure-boards/4-link-github-to-azure-boards .
- Development Section: Show linked GitHub code artifacts within the work item Development section https://learn.microsoft.com/en-us/training/modules/plan-agile-github-projects-azure-boards/4-link-github-to-azure-boards .
- Kanban Annotations: Show linked GitHub artifacts as annotations on Kanban board cards https://learn.microsoft.com/en-us/training/modules/plan-agile-github-projects-azure-boards/4-link-github-to-azure-boards .
- Status Badges: Support status badges of Kanban board columns added to GitHub repositories https://learn.microsoft.com/en-us/training/modules/plan-agile-github-projects-azure-boards/4-link-github-to-azure-boards .
Operational Tasks Supported
- Repository Management: Add or remove GitHub repositories participating in the integration and configure the project they connect to. Suspend Azure Boards-GitHub integration or uninstall the app https://learn.microsoft.com/en-us/training/modules/plan-agile-github-projects-azure-boards/4-link-github-to-azure-boards .
- GitHub Connection: Allow a GitHub repository to connect to one or more Azure Boards projects within the same Azure DevOps organization or collection https://learn.microsoft.com/en-us/training/modules/plan-agile-github-projects-azure-boards/4-link-github-to-azure-boards .
Limitations
Currently, querying for work items with links to GitHub artifacts is not supported. However, you can query for work items with an External Link Count greater than 0 https://learn.microsoft.com/en-us/training/modules/plan-agile-github-projects-azure-boards/4-link-github-to-azure-boards .
Additional Resources
For more detailed instructions and information on integrating Azure Boards with GitHub, refer to the following resources:
- Azure Boards-GitHub integration
- Change GitHub repository access, or suspend or uninstall the integration
- Add or remove GitHub repositories
- Link GitHub commits, pull requests, and issues to work items for details on linking to work items
- Connect Azure Boards to GitHub
By following these steps and utilizing the features provided, teams can achieve a seamless integration between their code repository and project management tools, enhancing collaboration and visibility across the development lifecycle.
Configure processes and communications (10–15%)
Configure collaboration and communication
Communicating Actionable Information with Custom Dashboards in Azure Boards
Azure Boards is a versatile project management tool that supports Agile, Scrum, and Kanban methodologies. It provides a rich set of features to track work, issues, and code defects associated with software projects. One of the key features of Azure Boards is the ability to create custom dashboards, which are essential for communicating actionable information to team members and stakeholders.
Custom Dashboards Overview
Custom dashboards in Azure Boards are configurable interfaces that display a collection of widgets to provide an at-a-glance overview of project status, progress, and metrics. These dashboards are designed to be highly customizable to meet the specific needs of different teams and stakeholders within an organization.
Key Benefits of Custom Dashboards
- Real-time Insights: Dashboards provide real-time updates on various aspects of the project, allowing team members to make informed decisions quickly.
- Enhanced Visibility: They offer visibility into the project’s health, progress, and trends, which is crucial for project management and stakeholder communication.
- Improved Collaboration: By sharing dashboards, teams can collaborate more effectively, as everyone has access to the same information.
- Increased Productivity: Dashboards can help identify bottlenecks and issues early, enabling teams to address them proactively and maintain productivity.
Configuring Custom Dashboards
To create a custom dashboard in Azure Boards:
- Navigate to the Dashboards section in Azure Boards.
- Click on the “New Dashboard” button to create a new dashboard.
- Add widgets to the dashboard by clicking the “Add Widget” button and selecting from the available options.
- Configure each widget according to the data you wish to display, such as work item queries, build and release status, test results, and more.
- Arrange and resize widgets to create a layout that best presents the information.
- Save the dashboard and share it with team members or stakeholders as needed.
Widgets and Their Uses
Widgets are the building blocks of Azure Boards dashboards. Some commonly used widgets include:
- Work Item Overview: Displays the status of work items such as user stories, bugs, and tasks.
- Build and Release Status: Shows the latest status of builds and releases, helping teams monitor the CI/CD pipeline.
- Burndown and Burnup Charts: Visualize the completion of work over time, aiding in sprint tracking and forecasting.
- Test Results: Summarize test pass rates and provide insights into software quality.
Additional Resources
For more detailed information on configuring and using custom dashboards in Azure Boards, the following resources can be helpful:
- Azure Boards documentation | Microsoft Docs
- Define dashboards in Azure Boards | Microsoft Docs
- Connect Azure Boards to GitHub
By leveraging custom dashboards in Azure Boards, teams can effectively communicate actionable information, ensuring that everyone involved in the project is informed and aligned with the project goals and status.
Configure processes and communications (10–15%)
Configure collaboration and communication
Documenting a Project Using Wikis and Process Diagrams
When documenting a project, it is essential to provide clear and accessible information that can be easily understood by all stakeholders. Two effective tools for project documentation are wikis and process diagrams.
Wikis for Project Documentation
A wiki is a collaborative tool that allows multiple users to create, edit, and organize content in a central location. It is an excellent way to document various aspects of a project, including design decisions, code snippets, meeting notes, and project plans.
To set up a wiki for your project, you can use platforms such as Azure DevOps, which offers a built-in wiki feature. Here’s how to get started:
Create a Wiki in Azure DevOps: Navigate to your Azure DevOps Organization and select the Team Project where you want to create the wiki. In the dashboard, you will find an option to set up a wiki. For detailed instructions, refer to Create a Wiki for your project - Azure DevOps.
Organize Content: Structure your wiki with pages and subpages to cover different topics, such as project overview, architecture, and user guides. Use a clear hierarchy to make it easy for users to find information.
Collaborate: Encourage team members to contribute to the wiki by adding and updating content. Azure DevOps wikis support markdown, which allows for formatting text, embedding images, and linking to other resources.
Maintain: Regularly review and update the wiki to ensure that the information remains current and relevant.
Process Diagrams for Visual Documentation
Process diagrams are visual representations of the steps involved in a process. They are useful for documenting workflows, system architectures, and deployment pipelines.
To create process diagrams, you can use tools such as Microsoft Visio or draw.io. Here’s a general approach to documenting with process diagrams:
Identify Processes: Determine which processes are crucial to the project and would benefit from visual documentation.
Choose the Right Diagram Type: Depending on the process, select an appropriate diagram type, such as flowcharts for workflows, sequence diagrams for operations, or architecture diagrams for system design.
Use Standard Notations: Apply standard notations like Unified Modeling Language (UML) or Business Process Model and Notation (BPMN) to ensure that diagrams are understandable by a wide audience.
Link Diagrams to Wikis: Embed your process diagrams within your project’s wiki pages to provide context and additional details. This integration allows users to see both the high-level view and the in-depth documentation in one place.
Keep Diagrams Updated: As the project evolves, update the diagrams to reflect any changes in the processes.
By combining wikis and process diagrams, you can create comprehensive documentation that is both informative and easy to navigate. This approach ensures that all project members have access to the knowledge they need to understand and contribute to the project effectively.
Configure processes and communications (10–15%)
Configure collaboration and communication
Configure Release Documentation
Release documentation is a critical component of the software deployment process. It provides stakeholders with the necessary information about what is being released, the changes included, and any specific steps or considerations required for the release. Here’s a detailed explanation of how to configure release documentation, including release notes and API documentation:
Release Notes
Release notes are documents that accompany a software release and include the following:
- Summary of Changes: A high-level overview of the new features, improvements, bug fixes, and any deprecated features.
- Detailed Change Log: A more detailed list of changes, often including issue tracker IDs, descriptions of the feature or bug, and the impact on the user.
- Known Issues: Any known issues or bugs that have not been resolved in the current release.
- Upgrade Instructions: Step-by-step instructions for users to upgrade from previous versions, including any necessary database migrations or configuration changes.
- Acknowledgments: Credits to contributors and acknowledgment of community feedback or customer support tickets that led to improvements.
To create effective release notes:
- Gather information from your issue tracking system and version control history.
- Organize the changes into categories (e.g., New Features, Improvements, Bug Fixes).
- Write clear and concise descriptions for each change.
- Review the notes for accuracy and completeness with the development team.
API Documentation
API documentation provides technical details about the APIs included in the software release, which is essential for developers who integrate with or build upon your product. It should include:
- Overview: A high-level description of the API, including its purpose and main features.
- Authentication: Instructions on how to authenticate with the API, including any keys or tokens required.
- Endpoints: A list of available API endpoints, their URLs, and the operations (GET, POST, PUT, DELETE) they support.
- Parameters: Details of the parameters for each endpoint, including required and optional parameters, data types, and default values.
- Request and Response Examples: Sample requests and responses for each endpoint, showing the structure of the data and how to use it.
- Error Codes: A list of possible error codes, their meanings, and how to handle them.
To create comprehensive API documentation:
- Use automated tools to generate documentation from your API’s source code, such as Swagger or Apiary.
- Ensure that the documentation is updated with each release to reflect any changes to the API.
- Provide interactive examples or a sandbox environment for developers to test the API.
Additional Resources
For more information on creating release documentation, you can refer to the following resources:
- Writing Release Notes
- Documenting APIs: A guide for technical writers
- Swagger: A tool for generating API documentation.
- Apiary: A platform for designing, developing, and documenting APIs.
Remember to keep your release documentation accessible, up-to-date, and in sync with your software releases to ensure a smooth deployment process and a positive experience for your users.
Configure processes and communications (10–15%)
Configure collaboration and communication
Automate Creation of Documentation from Git History
Automating the creation of documentation from Git history can streamline the process of generating accurate and up-to-date documentation for software projects. Git, a version control system, keeps a comprehensive history of changes made to the codebase, including who made the changes and when. This information can be leveraged to create documentation that reflects the evolution of the project.
Utilizing Git Tags and Releases
In Git, releases are iterations of software that can be packaged and distributed. These releases are based on Git tags, which are markers in the repository’s history indicating significant points, such as the completion of a feature or the release of a new version. Tags often contain version numbers, but they can represent other values as well. By examining the tags, one can view the history of a repository and understand the progression of the project https://learn.microsoft.com/en-us/training/modules/learn-continuous-integration-github-actions/7-mark-releases-git-tags .
Generating Documentation
To automate the creation of documentation from Git history, you can use scripts or tools that extract information from the repository’s logs. These scripts can parse commit messages, tags, and other metadata to produce a chronological record of changes, features, and bug fixes. This automated process ensures that the documentation is always synchronized with the codebase, reducing the likelihood of outdated or incorrect information.
Additional Resources
For more information on tags and releases in Git, you can refer to the official documentation on About releases https://learn.microsoft.com/en-us/training/modules/learn-continuous-integration-github-actions/7-mark-releases-git-tags .
Conclusion
Automating documentation from Git history not only saves time but also enhances the accuracy and reliability of the information provided to developers and stakeholders. By leveraging Git tags and releases, teams can maintain a clear and consistent record of their software’s development lifecycle.
Configure processes and communications (10–15%)
Configure collaboration and communication
Configure Notifications by Using Webhooks
Webhooks are user-defined HTTP callbacks that are triggered by specific events. When configuring notifications using webhooks in Azure Automation, you can enable external services to start runbooks through a single HTTPS request. This is particularly useful for integrating Azure Automation with services like Azure DevOps, GitHub, or custom applications, without the need for more complex solutions involving the Azure Automation API https://learn.microsoft.com/en-us/training/modules/explore-azure-automation-devops/6-examine-webhooks .
Steps to Create a Webhook in Azure Automation:
- Open the Runbook: In the Azure portal, navigate to the runbook you wish to link with a webhook https://learn.microsoft.com/en-us/training/modules/explore-azure-automation-devops/6-examine-webhooks .
- Add Webhook: Under the runbook’s Resources section, select Webhooks and then + Add webhook https://learn.microsoft.com/en-us/training/modules/explore-azure-automation-devops/6-examine-webhooks .
- Configure Webhook: Click on Create new
webhook and fill in the necessary details:
- Name: Choose a name for identification within Azure Automation. This name is not exposed externally https://learn.microsoft.com/en-us/training/modules/explore-azure-automation-devops/6-examine-webhooks .
- Enabled: By default, a webhook is enabled upon creation. It can be disabled if you do not want it to be used https://learn.microsoft.com/en-us/training/modules/explore-azure-automation-devops/6-examine-webhooks .
- Expires: Set an expiration date for the webhook. It can be modified later as long as the webhook has not expired https://learn.microsoft.com/en-us/training/modules/explore-azure-automation-devops/6-examine-webhooks .
- URL: The URL is automatically generated and contains a security token. Treat this URL as a password and store it securely, as it cannot be retrieved after creation https://learn.microsoft.com/en-us/training/modules/explore-azure-automation-devops/6-examine-webhooks .
- Parameters and Run Settings: If the runbook has
mandatory parameters, they must be provided during webhook creation. The
webhook cannot override these parameters when triggered. To receive data
from the client, the runbook can accept a parameter called
$WebhookDataof type[object]https://learn.microsoft.com/en-us/training/modules/explore-azure-automation-devops/6-examine-webhooks .
Using the Webhook:
- HTTP POST Request: To start the runbook linked to the webhook, the client application must issue an HTTP POST to the webhook’s URL https://learn.microsoft.com/en-us/training/modules/explore-azure-automation-devops/6-examine-webhooks .
- Syntax: The webhook URL follows the format
http://<Webhook Server>/token?=<Token Value>https://learn.microsoft.com/en-us/training/modules/explore-azure-automation-devops/6-examine-webhooks . - Response Codes: The client will receive HTTP status
codes indicating the result of the request, such as
202 Acceptedfor successful queuing of the runbook or400 Bad Requestif there are issues like an expired runbook or invalid token https://learn.microsoft.com/en-us/training/modules/explore-azure-automation-devops/6-examine-webhooks . - Job ID: A successful webhook response includes the job ID in JSON format, which can be used to track the runbook job’s status through other methods like PowerShell or the Azure Automation API https://learn.microsoft.com/en-us/training/modules/explore-azure-automation-devops/6-examine-webhooks .
Additional Information:
For more detailed guidance on starting an Azure Automation runbook with a webhook, you can refer to the official Microsoft documentation: Starting an Azure Automation runbook with a webhook https://learn.microsoft.com/en-us/training/modules/explore-azure-automation-devops/6-examine-webhooks https://learn.microsoft.com/en-us/training/modules/explore-azure-automation-devops/6-examine-webhooks .
By following these steps and understanding the process, you can effectively configure notifications using webhooks to automate runbook execution in response to external events, enhancing the automation capabilities of your Azure environment.
Design and implement source control (15–20%)
Design and implement a source control strategy
Design and Implement an Authentication Strategy
When designing and implementing an authentication strategy, it is crucial to consider several best practices and components to ensure the security and integrity of your applications and services. Here are some key points to consider:
Authentication and Authorization
Authentication is the process of verifying the identity of a user or service, and authorization determines the operations that the authenticated entity is allowed to perform. Use multifactor authentication (MFA) to add an extra layer of security, ensuring that even if one credential is compromised, unauthorized access is still prevented https://learn.microsoft.com/en-us/training/modules/security-monitoring-and-governance/2-implement-pipeline-security .
Role-Based Access Control (RBAC)
RBAC is a method of restricting system access to authorized users. It is one of the main methods for advanced access control, allowing permissions to be precisely aligned with the roles of users within the organization. This ensures that users only have the access necessary to perform their jobs https://learn.microsoft.com/en-us/training/modules/manage-application-configuration-data/9-manage-secrets-tokens-certificates https://learn.microsoft.com/en-us/training/modules/security-monitoring-and-governance/2-implement-pipeline-security .
Key Vault Access Policies
Azure Key Vault is a tool for securely storing and accessing secrets, keys, and certificates. Access to a key vault requires proper authentication and authorization. Key Vault access policies are used to grant permissions to users or applications to perform specific operations like read, write, delete, or list on the secrets, keys, and certificates stored in the vault https://learn.microsoft.com/en-us/training/modules/manage-application-configuration-data/9-manage-secrets-tokens-certificates .
Hardware Security Modules (HSMs)
For highly sensitive operations, you can use HSMs to protect the keys used for authentication. Azure Key Vault allows you to import or generate keys in HSMs that never leave the HSM boundary, providing an additional layer of security. Microsoft uses Thales HSMs, and you can use Thales tools to move a key from your HSM to Azure Key Vault https://learn.microsoft.com/en-us/training/modules/manage-application-configuration-data/9-manage-secrets-tokens-certificates .
Microsoft Entra ID
Authentication in Azure is handled via Microsoft Entra ID, which provides a secure and reliable way to manage identities and access for users and applications. It is essential to integrate this into your authentication strategy to ensure that identities are managed consistently across your services https://learn.microsoft.com/en-us/training/modules/manage-application-configuration-data/9-manage-secrets-tokens-certificates .
Best Practices for Operational Security
Operational security practices such as using different passwords for different accounts, managing Infrastructure as Code (IaC) with Azure Resource Manager, and implementing dynamic scanning for known attack patterns are essential. These practices help protect against phishing, privilege escalations, and other security threats https://learn.microsoft.com/en-us/training/modules/security-monitoring-and-governance/2-implement-pipeline-security .
Monitoring and Anomaly Detection
Implementing production monitoring and using specialized services for detecting anomalies related to intrusion, such as Microsoft Defender for Cloud, is a critical practice. These services focus on security incidents and help in maintaining the overall security posture of your Azure cloud environment https://learn.microsoft.com/en-us/training/modules/security-monitoring-and-governance/2-implement-pipeline-security .
For additional information on these topics, you can refer to the following resources: - Azure Key Vault documentation - Microsoft Defender for Cloud - Azure RBAC documentation - Microsoft Entra ID documentation
By carefully considering these aspects and integrating them into your authentication strategy, you can create a robust security framework that protects your applications and services from unauthorized access and potential security threats.
Design and implement source control (15–20%)
Design and implement a source control strategy
When designing a strategy for managing large files in a version control system, it is essential to consider tools like Git Large File Storage (LFS) and git-fat, which are specifically designed to handle large files efficiently. Here’s a detailed explanation of how these tools can be integrated into a file management strategy:
Git Large File Storage (LFS)
Git LFS is an open-source extension for Git that allows you to work with large files without storing them directly in the repository. Instead, Git LFS stores a pointer file in the repository, while the actual file content is stored on a remote server.
Key Features: - Version Control for Large Files: Git LFS tracks large files by storing references to the file in the repository, while the actual file contents are stored on a separate LFS server. - Efficient Storage: Large files are stored once on the LFS server, and Git LFS fetches them only when needed, reducing clone and fetch times. - Selective Download: Git LFS allows you to clone a repository without downloading all the large files immediately, which can save bandwidth and storage space.
Implementation Steps: 1. Install Git LFS on your
system. 2. Run git lfs install to set up Git LFS for your
user account. 3. Track large files with git lfs track,
specifying the file types to be managed by LFS. 4. Commit and push as
usual. Git LFS will handle the large files separately.
Best Practices: - Define which file types should be
tracked by Git LFS in your .gitattributes file. - Ensure
that all team members have Git LFS installed and configured. - Consider
the storage and bandwidth quotas of your Git LFS server when adding
large files.
git-fat
git-fat is another tool that can be used to manage large files in Git repositories. It works by storing the large files on a separate server and placing a placeholder in the repository.
Key Features: - Simple Storage Backend: git-fat uses rsync or an HTTP backend to store and retrieve large files, which can be simpler to set up and maintain. - Transparent to Users: Once configured, git-fat works transparently to the user, allowing them to work with large files as if they were part of the repository.
Implementation Steps: 1. Install git-fat on your
system. 2. Initialize git-fat in your repository with
git fat init. 3. Specify the backend and the large file
patterns in the .gitfat configuration file. 4. Use
git fat push and git fat pull to manage large
files.
Best Practices: - Regularly clean up the storage backend to remove old or unnecessary files. - Configure access controls to the storage backend to secure your large files. - Train your team on how to use git-fat commands for managing large files.
By integrating Git LFS or git-fat into your workflow, you can efficiently manage large files while keeping your Git repository size manageable and your operations fast. It’s important to evaluate both tools and choose the one that best fits your project’s needs and infrastructure.
For additional information on Git LFS and git-fat, you can visit the following resources: - Git LFS: Git Large File Storage - git-fat: git-fat on GitHub
Please note that while URLs are provided for reference, they should be accessed and evaluated for the latest information and best practices.
Design and implement source control (15–20%)
Design and implement a source control strategy
Designing a Strategy for Scaling and Optimizing a Git Repository
When working with large Git repositories, it’s essential to have a strategy in place to scale and optimize the repository to ensure efficient performance and manageability. Here are some key considerations and tools that can help in designing such a strategy:
Utilize Scalar for Git
Scalar is a set of tools and extensions for Git that optimizes large repositories. It works by enabling some core Git features that are beneficial for managing large codebases:
- Background Maintenance: Scalar runs maintenance tasks in the background, such as prefetching the latest changes from the remote repository and compressing database files, which can improve the performance of Git commands.
- Sparse Checkouts: Scalar supports sparse checkouts, which allow users to clone only a subset of the repository, reducing the amount of data that needs to be fetched and checked out.
- File System Monitor: It uses a file system monitor
to observe changes to the working directory, which can speed up commands
like
git statusby avoiding the need to scan the entire directory.
Implement Cross-Repository Sharing
Cross-repository sharing involves sharing code, binaries, and other assets across multiple repositories. This can be achieved through:
- Git Submodules: Submodules allow you to include other Git repositories as a subdirectory within your repository. This is useful for sharing common libraries or components.
- Git Subtree: Subtree merging is another way to include content from another repository, but it does not require a separate repository for the shared content. Instead, it is merged into the main repository as a subdirectory.
- Package Management Systems: For sharing binaries or compiled assets, consider using a package management system like Azure Artifacts, which allows you to create, host, and share packages with your team.
Best Practices for Repository Management
To further optimize your Git repository, consider the following best practices:
- Shallow Cloning: Use shallow cloning to clone only the recent history of a repository, which can significantly reduce the amount of data transferred.
- Regular Housekeeping: Perform regular housekeeping
tasks such as pruning stale branches and compressing the repository with
git gc. - Branch Policies: Implement branch policies in Azure DevOps to enforce code quality and security checks before code is merged into shared branches.
- Versioning Strategy: Adopt a versioning strategy like Semantic Versioning (SemVer) to manage the versions of your code systematically.
Additional Resources
For more information on the tools and strategies mentioned above, you can refer to the following resources:
- Scalar: About Scalar for Git
- Git Submodules: Git Tools - Submodules
- Git Subtree: Git Tools - Advanced Merging
- Azure Artifacts: Best practices for using Azure Artifacts
By implementing these strategies and utilizing the appropriate tools, you can effectively scale and optimize your Git repositories for better performance and collaboration within your development teams.
Design and implement source control (15–20%)
Design and implement a source control strategy
Implement Workflow Hooks
Workflow hooks are a critical component in automating processes within CI/CD pipelines. They allow you to trigger actions automatically when certain events occur in your version control system or CI/CD platform. Implementing workflow hooks can streamline the development process, reduce manual errors, and ensure that important steps are not skipped.
Implementing Automation with Azure DevOps
Azure DevOps provides a robust platform for implementing automation through various types of hooks. Here are some key concepts and steps to consider when setting up workflow hooks in Azure DevOps:
Create Webhooks: Webhooks in Azure DevOps can be used to trigger a CI/CD pipeline when a specific event occurs in your repository, such as a push to a branch or a pull request merge. To create a webhook, navigate to the service hooks section in your project settings, select the type of service hook you need, and configure it to respond to the desired events https://learn.microsoft.com/en-us/training/modules/explore-azure-automation-devops/1-introduction .
Manage Runbooks: Runbooks in Azure Automation can be linked to webhooks, allowing you to automate complex workflows. You can create a runbook to perform a set of tasks and then create a webhook that triggers the runbook. This is useful for automating deployment tasks, database updates, or any other operations that need to be performed automatically https://learn.microsoft.com/en-us/training/modules/explore-azure-automation-devops/1-introduction .
Workflow Runbook and PowerShell Workflows: Azure Automation supports the creation of workflow runbooks, which are based on PowerShell workflows. These runbooks can be particularly powerful when combined with webhooks, as they allow for parallel processing and can be paused and resumed, making them ideal for long-running operations https://learn.microsoft.com/en-us/training/modules/explore-azure-automation-devops/1-introduction .
Implementing GitHub Action Workflows
GitHub Actions is another powerful tool for implementing CI/CD workflows with hooks. Here’s how you can use GitHub Actions to automate your deployment processes:
GitHub Action Workflow for CI/CD: You can create a GitHub Action workflow that defines a series of steps to be executed when certain events occur in your GitHub repository. For example, you can set up a workflow that builds and tests your code every time a new commit is pushed to a specific branch https://learn.microsoft.com/en-us/training/modules/learn-continuous-integration-github-actions/10-implement-github-actions-for-ci-cd https://learn.microsoft.com/en-us/training/modules/learn-continuous-integration-github-actions/10-implement-github-actions-for-ci-cd .
Deploying an Azure Web App: GitHub Actions can be used to deploy applications to Azure services, such as Azure Web Apps. You can define a workflow that builds your application, creates a Docker image, pushes the image to a container registry, and then deploys it to an Azure Web App when a push to the master branch occurs https://learn.microsoft.com/en-us/training/modules/learn-continuous-integration-github-actions/10-implement-github-actions-for-ci-cd https://learn.microsoft.com/en-us/training/modules/design-container-build-strategy/8-deploy-docker-containers-to-azure-app-service-web-apps .
Additional Resources
For more information on implementing workflow hooks and automating your CI/CD processes, you can refer to the following resources:
- What are Azure Artifacts?: Learn more about Azure Artifacts and how they can be integrated into your CI/CD pipeline for seamless package management https://learn.microsoft.com/en-us/training/modules/software-composition-analysis/3-explore-software-composition-analysis .
- GitHub Actions Documentation: Explore the official GitHub Actions documentation to understand how to create and manage workflows in GitHub.
- Azure DevOps Services Documentation: Dive into the Azure DevOps documentation for detailed guidance on setting up service hooks, runbooks, and more.
By implementing workflow hooks in your CI/CD pipelines, you can significantly enhance the automation and efficiency of your development and deployment processes.
Design and implement source control (15–20%)
Plan and implement branching strategies for the source code
Designing a Branch Strategy
When designing a branch strategy for version control in a software development project, it is essential to consider the various types of branches that can be used to manage code changes effectively. Three common branch strategies are trunk-based development, feature branches, and release branches. Each strategy serves a different purpose and can be used in combination to support a robust development workflow.
Trunk-Based Development
Trunk-based development is a source-control branching model where developers collaborate on code in a single branch called the “trunk.” This approach minimizes the complexity of merging and integrates changes more frequently.
- Advantages:
- Reduces merge conflicts due to frequent integration.
- Encourages continuous integration and delivery.
- Simplifies the branching model, making it easier for new team members to understand.
- Considerations:
- Requires a disciplined team to ensure the trunk is always in a releasable state.
- Feature toggles may be necessary to hide incomplete features.
Feature Branches
Feature branches are used to develop new features or changes in isolation from the main codebase. Each feature is developed in its branch and merged back into the main branch upon completion.
- Advantages:
- Isolates development work, allowing for focused effort on a specific feature.
- Reduces the risk of destabilizing the main codebase with incomplete features.
- Considerations:
- Can lead to complex merges if branches live for a long time.
- Requires coordination when multiple feature branches need to be integrated.
Release Branches
Release branches are created from the main branch to prepare for a new product release. They allow for last-minute fixes, performance optimizations, and other release-specific tasks without affecting ongoing development in the main branch.
- Advantages:
- Separates the release process from ongoing development work.
- Provides a stable base for final testing and bug fixing.
- Considerations:
- Requires careful management to ensure that fixes made on the release branch are also applied to the main branch.
- Can create additional overhead if not managed efficiently.
For more information on branch strategies, you can refer to the following resources: - Branch strategies with Azure Repos - Adopt a Git branching strategy
By understanding and implementing these branch strategies, teams can ensure a smooth and efficient workflow, allowing for continuous integration and delivery of high-quality software.
Design and implement source control (15–20%)
Plan and implement branching strategies for the source code
Design and Implement a Pull Request Workflow Using Branch Policies and Branch Protections
When designing and implementing a pull request workflow, it is crucial to establish branch policies and protections to maintain code quality and security. Here’s a detailed explanation of how to achieve this:
Branch Policies
Branch policies are a set of rules that govern how code is committed to a repository, ensuring that certain criteria are met before changes can be merged. These policies can be enabled in Azure DevOps using Git source control to provide a gated commit experience.
Pull Requests: Require pull requests for changes to be merged into the shared branch. This initiates a review process and executes all defined controls https://learn.microsoft.com/en-us/training/modules/introduction-to-secure-devops/5-explore-key-validation-points .
Code Reviews: Mandate code reviews before a pull request can be completed. This manual check is essential for identifying potential issues introduced into the code https://learn.microsoft.com/en-us/training/modules/introduction-to-secure-devops/5-explore-key-validation-points .
Work Item Linking: Ensure that commits are linked to work items. This provides an audit trail for the changes made and the reasons behind them https://learn.microsoft.com/en-us/training/modules/introduction-to-secure-devops/5-explore-key-validation-points .
Continuous Integration (CI) Builds: Require a successful CI build before a pull request can be completed. This ensures that the new code does not break the existing build https://learn.microsoft.com/en-us/training/modules/introduction-to-secure-devops/5-explore-key-validation-points .
Branch Protections
Branch protections are additional safeguards that can be applied to specific branches to prevent direct pushes, force code reviews, and manage who can make changes.
Trigger Events: Define events that trigger actions, such as
on: pull_requestfor when a pull request is made, oron: [push, pull_request]for both push and pull request events. You can specify the branch these events apply to, for example,on: pull_request: branches: - developto apply the rule only to the develop branch https://learn.microsoft.com/en-us/training/modules/introduction-to-github-actions/6-explore-events .Status Badges: Utilize badges to display the status of workflows within a repository. These badges indicate whether the workflow is passing or failing and are typically added to the README.md file. The URL for a badge is formed using the account name, repository name, and workflow name https://learn.microsoft.com/en-us/training/modules/learn-continuous-integration-github-actions/5-examine-workflow-badges .
Referencing Branches: When requesting actions, refer to the specific branch you want to work with to get the latest version. This ensures that you benefit from updates, although it may increase the risk of code-breaking changes https://learn.microsoft.com/en-us/training/modules/introduction-to-github-actions/9-examine-release-test-action .
Manual Triggers: Use the workflow_dispatch event to trigger workflow runs manually. This event must be used in the default branch of the repository https://learn.microsoft.com/en-us/training/modules/introduction-to-github-actions/6-explore-events .
By implementing these branch policies and protections, you create a robust pull request workflow that enhances the quality and security of your codebase.
For more information on adding workflow status badges, please refer to the GitHub documentation on Adding a workflow status badge https://learn.microsoft.com/en-us/training/modules/learn-continuous-integration-github-actions/5-examine-workflow-badges .
Remember, these practices are part of a broader strategy to ensure continuous integration and delivery in your software development lifecycle. They help to automate the process, reduce errors, and maintain a high standard of code quality.
Design and implement source control (15–20%)
Plan and implement branching strategies for the source code
Implementing Branch Merging Restrictions Using Branch Policies and Branch Protections
Branch merging restrictions are essential for maintaining the
integrity and stability of code in a shared repository. By implementing
branch policies and protections, teams can enforce certain conditions
that must be met before code can be merged into a protected branch, such
as main or develop. This ensures that only
high-quality, reviewed code is integrated, reducing the risk of
introducing errors or vulnerabilities.
Branch Policies in Azure DevOps
In Azure DevOps, branch policies provide a gated commit experience that helps prevent security vulnerabilities from being introduced into the Continuous Integration/Continuous Deployment (CI/CD) process. Here are the key components of branch policies in Azure DevOps:
Pull Request Requirements: To merge changes into a protected branch, a pull request must be created. This initiates a review process where peers can examine the proposed changes before they are integrated https://learn.microsoft.com/en-us/training/modules/introduction-to-secure-devops/5-explore-key-validation-points .
Code Reviews: A code review is a manual check that is an important part of identifying new issues. Branch policies can require that at least one or more reviewers approve the changes in the pull request before the merge can proceed https://learn.microsoft.com/en-us/training/modules/introduction-to-secure-devops/5-explore-key-validation-points .
Work Item Linking: For auditing purposes, commits should be linked to work items. This provides a clear rationale for why the code change was made and allows for better tracking of work https://learn.microsoft.com/en-us/training/modules/introduction-to-secure-devops/5-explore-key-validation-points .
Continuous Integration (CI) Builds: A CI build process must succeed before the push can be completed. This ensures that the new code does not break the build and meets the quality standards set by the team https://learn.microsoft.com/en-us/training/modules/introduction-to-secure-devops/5-explore-key-validation-points .
Enabling Branch Policies: To enable branch policies, you must configure them on the shared branch in Azure DevOps. This is done by requiring a pull request to start the merge process and ensuring the execution of all defined controls https://learn.microsoft.com/en-us/training/modules/introduction-to-secure-devops/5-explore-key-validation-points .
For more information on setting up branch policies in Azure DevOps, you can refer to the official documentation: Configure branch policies.
Branch Protections on GitHub
Branch protections in GitHub are similar to branch policies in Azure DevOps and are used to enforce certain standards. Here’s how you can implement branch protections on GitHub:
Protected Branches: Designate certain branches as “protected.” These branches cannot be directly pushed to; instead, changes must go through a pull request.
Status Checks: Require status checks to pass before merging. This can include passing a CI build or other automated checks to ensure code quality.
Required Reviews: Enforce code reviews by requiring pull requests to have a certain number of approving reviews before they can be merged.
Restrict Who Can Push: Limit who can push to the protected branch, ensuring that only authorized users can merge code into it.
For additional details on GitHub branch protections, you can visit the following resource: About protected branches.
By implementing these branch merging restrictions, teams can significantly reduce the risk of introducing errors, ensure compliance with development workflows, and maintain a high standard of code quality.
Design and implement source control (15–20%)
Configure and manage repositories
Integrating GitHub repositories with Azure Pipelines is a crucial aspect of implementing Continuous Integration/Continuous Deployment (CI/CD) practices within a DevOps workflow. This integration allows for the automation of code building, testing, and deployment processes whenever a change is made to the repository. Here’s a detailed explanation of how to achieve this integration:
Connecting GitHub Repositories to Azure Pipelines
Authentication: To connect Azure Boards to GitHub, you can use either a Username/Password combination or a Personal Access Token (PAT) for authentication https://learn.microsoft.com/en-us/training/modules/plan-agile-github-projects-azure-boards/4-link-github-to-azure-boards .
Integration Setup:
- From the Azure Boards web portal, you can add or remove GitHub repositories https://learn.microsoft.com/en-us/training/modules/plan-agile-github-projects-azure-boards/4-link-github-to-azure-boards .
- You can also configure connections to other Azure Boards/Azure DevOps Projects or GitHub.com repositories from the Azure Boards app page https://learn.microsoft.com/en-us/training/modules/plan-agile-github-projects-azure-boards/4-link-github-to-azure-boards .
Operational Tasks Supported:
- Link work items in Azure Boards to GitHub commits, pull requests, and issues using GitHub mentions https://learn.microsoft.com/en-us/training/modules/plan-agile-github-projects-azure-boards/4-link-github-to-azure-boards .
- Automatically transition work items to a Done or Completed state when a GitHub mention includes keywords like fix, fixes, or fixed https://learn.microsoft.com/en-us/training/modules/plan-agile-github-projects-azure-boards/4-link-github-to-azure-boards .
- Maintain full traceability by posting a discussion comment to GitHub when linking from a work item to a GitHub commit, pull request, or issue https://learn.microsoft.com/en-us/training/modules/plan-agile-github-projects-azure-boards/4-link-github-to-azure-boards .
- Visualize linked GitHub code artifacts within the work item Development section and as annotations on Kanban board cards https://learn.microsoft.com/en-us/training/modules/plan-agile-github-projects-azure-boards/4-link-github-to-azure-boards .
- Add status badges of Kanban board columns to GitHub repositories to reflect the current status https://learn.microsoft.com/en-us/training/modules/plan-agile-github-projects-azure-boards/4-link-github-to-azure-boards .
Unsupported Tasks:
- Currently, querying for work items with links to GitHub artifacts is not supported, but you can query for work items with an External Link Count greater than 0 https://learn.microsoft.com/en-us/training/modules/plan-agile-github-projects-azure-boards/4-link-github-to-azure-boards .
Additional Features:
- The Visual Studio Code Marketplace offers a suite of extensions that facilitate the integration of security products into the Azure DevOps pipeline, enhancing the Secure DevOps practices https://learn.microsoft.com/en-us/training/modules/software-composition-analysis/4-integrate-whitesource-azure-devops-pipeline .
Configuration and Secrets Management:
- It is recommended to rethink application configuration data and adopt the separation of concerns method https://learn.microsoft.com/en-us/training/modules/manage-application-configuration-data/1-introduction .
- Integrate Azure Key Vault with Azure Pipelines to manage secrets and configuration patterns securely https://learn.microsoft.com/en-us/training/modules/manage-application-configuration-data/1-introduction .
For more information on how to integrate GitHub repositories with Azure Pipelines, you can refer to the following resources:
- Change GitHub repository access, or suspend or uninstall the integration https://learn.microsoft.com/en-us/training/modules/plan-agile-github-projects-azure-boards/4-link-github-to-azure-boards .
- Add or remove GitHub repositories https://learn.microsoft.com/en-us/training/modules/plan-agile-github-projects-azure-boards/4-link-github-to-azure-boards .
- Link GitHub commits, pull requests, and issues to work items for details on linking to work items https://learn.microsoft.com/en-us/training/modules/plan-agile-github-projects-azure-boards/4-link-github-to-azure-boards .
- Connect Azure Boards to GitHub https://learn.microsoft.com/en-us/training/modules/plan-agile-github-projects-azure-boards/4-link-github-to-azure-boards .
By following these steps and utilizing the provided resources, you can effectively integrate GitHub repositories with Azure Pipelines, streamlining your DevOps processes and enhancing collaboration between development and operations teams.
Design and implement source control (15–20%)
Configure and manage repositories
Configure Permissions in the Source Control Repository
When configuring permissions in a source control repository, it is essential to understand that permissions play a critical role in securing your codebase and ensuring that team members have the appropriate access levels for their roles. Here are the steps and considerations for setting up permissions in a source control repository:
Identify Source Control System: Determine which source control system you are using. Azure Automation supports integration with GitHub, Azure DevOps Git, and Azure DevOps TFVC https://learn.microsoft.com/en-us/training/modules/explore-azure-automation-devops/7-explore-source-control-integration .
Access Control Settings: In the case of Azure DevOps, navigate to your project settings and locate the Repositories section under Repos. For GitHub, you would go to the repository settings and then to the Collaborators & teams tab.
Assign User Roles: Assign roles or permissions to team members based on their responsibilities. Common roles include Read, Write, and Admin. In Azure DevOps, you can also create custom roles with specific permissions https://learn.microsoft.com/en-us/training/modules/software-composition-analysis/9-implement-security-compliance-azure-pipeline .
Branch Policies: Implement branch policies to protect important branches. For instance, you might require pull request reviews before merging or enforce build validation.
Repository Settings: Configure repository settings to control who can create new branches or tags. This can help maintain a clean and organized repository structure.
Audit and Review: Regularly audit permissions and review access levels to ensure they are still appropriate for each team member’s current role.
Automate Permissions: Consider automating permission settings as part of your Infrastructure as Code (IaC) strategy, ensuring that permissions are consistent across environments and can be tracked via source control https://learn.microsoft.com/en-us/training/modules/configure-provision-environments/2-provision-configure-target-environments .
For additional information on setting up and managing permissions in Azure DevOps, you can refer to the official documentation at Azure DevOps Permissions.
For GitHub, the official documentation on managing team access to an organization repository can be found at GitHub Repository Permissions.
Remember to tailor the permissions to the needs of your project and team, and keep security best practices in mind when configuring your source control repository.
Design and implement source control (15–20%)
Configure and manage repositories
Configure Tags to Organize the Source Control Repository
When managing a source control repository, tags are a powerful tool for organizing and marking specific points in your repository’s history. Tags are often used to mark release points (v1.0, v2.0, etc.) and can help you quickly navigate to important milestones or versions of your code.
Using Tags in Git
In Git, a tag is a reference to a specific commit. Tags are immutable, which means that once they are created, they should not change. Here’s how you can work with tags in Git:
Creating a Tag: To create a lightweight tag, you simply need to specify the tag name and the commit it refers to:
git tag <tagname> <commitID>For annotated tags, which include metadata such as the tagger’s name, email, and date, use the
-aflag:git tag -a <tagname> -m "message" <commitID>Listing Tags: To see a list of all tags in the repository, use the
git tagcommand without arguments.git tagPushing Tags to Remote: By default, the
git pushcommand does not transfer tags to remote servers. To push a specific tag to your remote repository, use the following command:git push origin <tagname>To push all your tags at once, use
--tagswith thegit pushcommand:git push origin --tagsChecking Out Tags: To view the state of your repository at the point of a specific tag, you can check out the tag:
git checkout tags/<tagname>
Best Practices for Tagging
Semantic Versioning: Follow semantic versioning principles when naming your tags. This means using version numbers like
MAJOR.MINOR.PATCHto convey meaning about the underlying changes.Annotated Tags: Prefer annotated tags over lightweight tags for releases, as they include more information about the release itself.
Immutable Tags: Treat tags as immutable references. Do not change the commit a tag points to once it has been published.
Tagging Policy: Establish a clear tagging policy within your team to ensure consistency and clarity in your repository’s history.
Additional Resources
For more detailed information on tags in Git, you can refer to the official Git documentation on tagging: Git Basics - Tagging.
To learn more about semantic versioning, visit the Semantic Versioning website: Semantic Versioning 2.0.0.
Remember, tags are a key part of your source control strategy and can greatly enhance the maintainability and clarity of your codebase. Use them wisely to mark important milestones and releases in your project’s lifecycle.
Design and implement source control (15–20%)
Configure and manage repositories
Recover Data by Using Git Commands
When working with Git, it’s not uncommon to need to recover data that has been lost or incorrectly modified. Here are some key Git commands and strategies that can help you recover data:
Undoing Local Changes
git checkout: This command can be used to revert changes to a modified file by checking out the last committed version.git checkout -- <file>git reset: To undo changes staged for commit, you can use:git reset HEAD <file>For a more forceful approach, to discard all local changes in the working directory, use:
git reset --hard
Restoring Deleted Files
git checkout: If you’ve deleted a file and want to restore it from the last commit:git checkout HEAD -- <file>
Recovering Lost Commits
git reflog: This command shows a log of where the tips of branches and other references were in the past. You can find the reference to a lost commit here.git refloggit reset: Once you have the reference from the reflog, you can reset to that commit to recover it.git reset --hard <commit-ref>
Reverting Commits
git revert: This command creates a new commit that undoes the changes from a previous commit. This is a safe way to undo changes on a public branch.git revert <commit>
Fixing a Pushed Commit
git commit --amend: If you need to alter the most recent commit, perhaps to add a missed file or change the commit message, you can amend it. Note that this creates a new commit hash and should be used with caution if the commit has already been pushed.git commit --amendgit push --force: If you’ve already pushed the commit you amended, you’ll need to force push. This can disrupt others working on the same repository, so coordinate with your team before using this command.git push --force
Handling Merge Conflicts
When a merge conflict occurs, Git will pause the merge and mark the conflicted files. You can manually edit the files to resolve the conflicts and then continue the merge process with:
git add <resolved-file>
git commit
For more detailed information on using these Git commands, you can refer to the official Git documentation: Git Documentation.
Remember, it’s always a good practice to back up your data and commit
frequently to minimize the risk of data loss. Additionally, be cautious
when rewriting history with commands like git reset --hard
or git push --force as these can permanently remove data
and disrupt the workflow of others.
Design and implement source control (15–20%)
Configure and manage repositories
Purge Data from Source Control
When managing source control, especially in a DevOps environment, it’s crucial to understand how to effectively purge data. Purging data from source control refers to the process of permanently removing files, branches, or commits from a repository. This action is often taken to clean up unnecessary files, to reduce the size of the repository, or to remove sensitive data that was committed accidentally.
Steps to Purge Data
Identify the Data to Purge: Before purging, you must clearly identify what needs to be removed. This could be specific files, commits containing sensitive information, or entire branches that are no longer needed.
Create a Backup: Always create a backup of the data before purging. This ensures that you can recover any information if needed after the purge.
Use Source Control Tools: Utilize the tools provided by your source control system to remove the data. For example, in Git, you can use commands like
git rmfor removing files orgit filter-branchfor editing multiple commits.Force Push (if necessary): After purging data locally, you may need to force push the changes to the remote repository. This action will overwrite the history on the remote repository with your local history.
Inform Your Team: Notify your team about the purge, especially if it affects the remote repository. This is important because it can impact their local clones and any work in progress.
Update Source Control Settings: If the purge was done to remove sensitive data, consider updating your repository settings to prevent future leaks. This might include adding file ignore rules or setting up commit hooks that check for sensitive information.
Considerations
- Impact on History: Purging data can rewrite the history of your repository. This can cause issues for collaborators who have based their work on the affected history.
- Security: Purging sensitive data from source control does not guarantee that it’s removed from all backups or clones that may exist elsewhere.
- Best Practices: Regularly review and maintain your repositories to avoid the need for purging. Implement policies that prevent the accidental commit of sensitive data.
For more detailed information on source control integration and management within Azure Automation, you can refer to the Azure documentation on source control integration here.
Please note that the exact commands and procedures for purging data may vary depending on the source control system you are using (e.g., GitHub, Azure DevOps Git, or Azure DevOps TFVC) https://learn.microsoft.com/en-us/training/modules/explore-azure-automation-devops/7-explore-source-control-integration . Always refer to the official documentation of the source control system for the most accurate and up-to-date instructions.
Design and implement build and release pipelines (40–45%)
Design and implement pipeline automation
Integrating pipelines with external tools is a crucial aspect of modern software development, particularly when it comes to ensuring the security and quality of the code. Here’s a detailed explanation of how to integrate pipelines with dependency scanning, security scanning, and code coverage tools:
Dependency Scanning
Dependency scanning is the process of analyzing the libraries and packages that your application depends on to identify known vulnerabilities. Tools like Mend can be integrated into your CI/CD pipeline to automatically scan for issues related to open-source security, quality, and license compliance https://learn.microsoft.com/en-us/training/modules/software-composition-analysis/4-integrate-whitesource-azure-devops-pipeline .
How to Integrate: - Use the Mend extension available on the Azure DevOps Marketplace to integrate dependency scanning into your pipeline. - Configure the extension to run as part of your build process, ensuring that any open-source packages used by your application are scanned for vulnerabilities.
Security Scanning
Security scanning involves analyzing the application code to identify security weaknesses. Tools such as SonarQube, Visual Studio Code Analysis, Roslyn Security Analyzers, Checkmarx, and BinSkim can be integrated into your Azure Pipelines to perform Static Application Security Testing (SAST) https://learn.microsoft.com/en-us/training/modules/introduction-to-secure-devops/6-explore-continuous-security-validation .
How to Integrate: - Select a security scanning tool that fits your project’s needs and ensure it supports integration with Azure Pipelines. - Add the tool to your pipeline configuration to run static code analysis tests during the CI build process. - Configure the tool to provide alerts and reports on any security issues found.
Code Coverage
Code coverage measures how much of your code is executed during automated tests, which is an important metric for understanding the effectiveness of your test suite.
How to Integrate: - Choose a code coverage tool that is compatible with your testing framework and can be integrated into Azure DevOps. - Update your pipeline configuration to include code coverage analysis as part of the test execution step. - Review code coverage reports to identify untested parts of your code and improve your test cases accordingly.
Additional Resources: - For more information on integrating security and compliance tools, visit the Visual Studio Marketplace. - To learn about configuring GitHub Dependabot alerts and security, refer to the GitHub documentation.
By integrating these tools into your pipelines, you can automate the process of identifying and addressing security vulnerabilities, license issues, and code quality concerns, leading to more secure and reliable software.
Please note that while URLs have been requested, I am unable to provide them directly. However, you can find more information and the necessary tools for integration on the Azure DevOps Marketplace and the Visual Studio Marketplace.
Design and implement build and release pipelines (40–45%)
Design and implement pipeline automation
Design and Implement Quality and Release Gates, Including Security and Governance
Quality and release gates are critical components in a Continuous Delivery (CD) pipeline that help ensure that only code that meets certain predefined criteria is promoted through the pipeline stages and ultimately deployed to production. These gates serve as checkpoints that validate the quality, security, and compliance of the code before it moves forward in the release process.
Quality Gates
Quality gates are automated checks that enforce a quality policy within an organization. They are positioned at strategic points in the CD pipeline to determine whether the application can proceed to the next stage or if it needs further work. Quality gates can include a variety of checks, such as:
- No new blocker issues: Ensuring that the code does not introduce any critical issues that could block the release.
- Code coverage on new code: Verifying that a certain percentage of the new code is covered by automated tests, typically aiming for a threshold like 80%.
- No license violations: Checking for compliance with software licensing requirements.
- No vulnerabilities in dependencies: Ensuring that there are no known security vulnerabilities in the third-party libraries and dependencies used by the application.
- Technical debt: Confirming that the release does not increase the technical debt of the project.
- Performance checks: Making sure that the performance of the application is not adversely affected by the new changes.
- Compliance checks: Verifying that all regulatory and policy compliance requirements are met, such as linking work items to the release or ensuring separation of duties in the release process https://learn.microsoft.com/en-us/training/modules/explore-release-strategy-recommendations/7-use-release-gates-to-protect-quality .
Release Gates
Release gates are similar to quality gates but are specifically used within the release pipeline to control the promotion of deployments across environments. They can be configured as pre-deployment or post-deployment conditions and can include:
- Pre-deployment gates: These ensure that there are no active issues in the work item or problem management system before deploying a build to an environment.
- Post-deployment gates: These ensure that there are no incidents from the app’s monitoring or incident management system after deployment before promoting the release to the next environment https://learn.microsoft.com/en-us/training/modules/explore-release-strategy-recommendations/8-control-deployments-using-release-gates .
Release gates can be implemented using various methods, such as:
- Invoke Azure Function: This gate triggers the execution of an Azure Function and ensures its successful completion.
- Query Azure Monitor alerts: This gate checks for active alerts in Azure Monitor alert rules.
- Invoke REST API: This gate makes a call to a REST API and continues if it returns a successful response.
- Query work items: This gate ensures that the number of matching work items returned from a query is within a specified threshold https://learn.microsoft.com/en-us/training/modules/explore-release-strategy-recommendations/8-control-deployments-using-release-gates .
Security and Governance
In addition to quality checks, security and governance are also essential considerations for release gates. These can include:
- Security testing tools: Integrating tools that scan for security vulnerabilities and compliance issues. If a tool finds a compliance problem, it can prevent deployment through a release gate https://learn.microsoft.com/en-us/training/modules/explore-release-strategy-recommendations/9-knowledge-check .
- Governance policies: Enforcing organizational policies and governance standards, such as ensuring that all changes are reviewed and approved by the appropriate personnel.
By implementing quality and release gates with a focus on security and governance, organizations can significantly reduce the risk of deploying faulty or non-compliant code to production, thereby maintaining the integrity and reliability of their applications.
For more information on configuring release pipelines and gates, you can refer to the following resources: - [Configure release pipelines] https://learn.microsoft.com/en-us/training/modules/explore-release-strategy-recommendations/8-control-deployments-using-release-gates - [Configure release gates] https://learn.microsoft.com/en-us/training/modules/explore-release-strategy-recommendations/8-control-deployments-using-release-gates - [Test release gates] https://learn.microsoft.com/en-us/training/modules/explore-release-strategy-recommendations/8-control-deployments-using-release-gates - [Explore release strategy recommendations] https://learn.microsoft.com/en-us/training/modules/explore-release-strategy-recommendations/8-control-deployments-using-release-gates
Please note that the URLs provided are for additional information and are part of the retrieved documents.
Design and implement build and release pipelines (40–45%)
Design and implement pipeline automation
Design Integration of Automated Tests into Pipelines
When designing the integration of automated tests into pipelines, it is essential to consider the following aspects to ensure a robust and efficient Continuous Integration/Continuous Delivery (CI/CD) process:
Test Categorization and Strategy
Automated testing should be strategically categorized to cover different aspects of the application. Lisa Crispin’s Agile Testing quadrants provide a useful framework for this https://learn.microsoft.com/en-us/training/modules/configure-provision-environments/4-configure-automated-integration-functional-test-automation :
- Quadrant 1: Technology Facing Tests that Support the
Team
- Includes Unit tests, Component tests, and Integration tests.
- These tests are typically automated and are executed by developers.
- Quadrant 2: Business Facing Tests that Support the
Team
- Functional tests, Story tests, Prototypes, and Simulations fall into this category.
- They are often automatable and help ensure the correct functionality from a business perspective.
- Quadrant 3: Business Facing Tests that Critique the
Product
- Exploratory, Usability, and Acceptance tests are placed here.
- These tests are more challenging to automate and are often executed manually.
- Quadrant 4: Technology Facing Tests that Critique the
Product
- Performance, Load, Security, and other non-functional requirements tests are included.
- These tests are generally automated or automated by nature.
Shift-Left Testing
Shift-left testing involves moving testing earlier in the development process, which allows for quicker feedback and issue resolution https://learn.microsoft.com/en-us/training/modules/configure-provision-environments/4-configure-automated-integration-functional-test-automation .
Automation Principles
To effectively integrate automated tests into pipelines, consider the following principles https://learn.microsoft.com/en-us/training/modules/configure-provision-environments/4-configure-automated-integration-functional-test-automation :
- Tests should be written at the lowest level possible to reduce the need for complex infrastructure during testing.
- Tests should be designed to run anywhere, including production environments.
- The product should be designed with testability in mind.
- Test code is as important as product code and should be maintained with the same rigor.
- Test ownership should align with product ownership to ensure accountability.
Test Execution in Pipelines
Automated tests should be integrated into the CI/CD pipeline to run at appropriate stages https://learn.microsoft.com/en-us/training/modules/configure-provision-environments/4-configure-automated-integration-functional-test-automation :
- Unit and Low-Level Tests: These can be executed by the build agent and do not require a deployed application or infrastructure.
- UI and Specialized Tests: These may require a Test agent to execute and report results. The installation of the test agent should be part of the pipeline setup.
Tooling and Language Consistency
When writing automated tests, it is advisable to use the same programming language as the application code to facilitate maintenance and understanding https://learn.microsoft.com/en-us/training/modules/configure-provision-environments/4-configure-automated-integration-functional-test-automation .
Utilizing Extensions and Tools
The Visual Studio Code Marketplace offers a suite of extensions that can be integrated into Azure Pipelines for security and other specialized testing needs https://learn.microsoft.com/en-us/training/modules/software-composition-analysis/4-integrate-whitesource-azure-devops-pipeline .
Release Strategy and Pipeline Components
Understanding the components of a release pipeline, artifact sources, and how to create approvals and configure release gates is crucial for a successful deployment strategy https://learn.microsoft.com/en-us/training/modules/explore-release-strategy-recommendations/1-introduction .
Continuous Delivery (CD) Pipeline
Setting up a CD pipeline is essential for deploying applications to environments that are accessible to users. Azure DevOps provides tools and services to facilitate this process https://learn.microsoft.com/en-us/training/modules/create-release-pipeline/1-introduction .
Package Management
Azure Artifacts is a key component of Secure DevOps, providing a trusted feed for the CI pipeline and ensuring that all artifacts are organized, protected, and seamlessly integrated into the CI/CD process https://learn.microsoft.com/en-us/training/modules/software-composition-analysis/3-explore-software-composition-analysis .
For more information on Azure Artifacts and package management, you can visit the What are Azure Artifacts? page https://learn.microsoft.com/en-us/training/modules/software-composition-analysis/3-explore-software-composition-analysis .
By considering these elements, you can design a pipeline that effectively integrates automated tests, ensuring that your application is thoroughly tested and ready for production.
Design and implement build and release pipelines (40–45%)
Design and implement pipeline automation
Design and Implement a Comprehensive Testing Strategy
A comprehensive testing strategy is essential to ensure the quality and reliability of software throughout its development lifecycle. This strategy encompasses various types of tests, each serving a specific purpose and providing unique insights into the software’s functionality and performance.
Local Tests
Local tests are performed by developers on their machines before integrating their code into the main codebase. These tests typically include:
- Unit Tests: These are the most granular tests, focusing on individual functions or methods. Unit tests verify that each piece of the code performs as expected in isolation. They are quick to run and help developers catch issues early in the development process https://learn.microsoft.com/en-us/training/modules/design-container-build-strategy/5-examine-multi-stage-dockerfiles .
Unit Tests
Unit tests are automated tests written and run by software developers to ensure that a section of an application (known as the “unit”) meets its design and behaves as intended. In the context of Continuous Integration/Continuous Delivery (CI/CD), unit tests can be incorporated into the build process to automatically validate code changes https://learn.microsoft.com/en-us/training/modules/design-container-build-strategy/5-examine-multi-stage-dockerfiles .
Example of a Dockerfile stage to run unit tests:
FROM build AS test
WORKDIR /src/Web.test
RUN dotnet test
If the unit tests fail, the build process is halted to prevent the propagation of defects https://learn.microsoft.com/en-us/training/modules/design-container-build-strategy/5-examine-multi-stage-dockerfiles .
Integration Tests
Integration tests verify that different modules or services used by your application work well together. These tests are crucial for identifying issues that occur when individual modules that work fine on their own are combined https://learn.microsoft.com/en-us/training/modules/configure-provision-environments/4-configure-automated-integration-functional-test-automation .
Load Tests
Load tests are non-functional tests that determine how the system behaves under both normal and anticipated peak load conditions. They help to identify the maximum operating capacity of an application as well as any bottlenecks and determine which element is causing degradation https://learn.microsoft.com/en-us/training/modules/configure-provision-environments/4-configure-automated-integration-functional-test-automation .
When designing a testing strategy, consider the following principles:
- Automate Where Possible: Automation is key to executing tests frequently and consistently. It’s especially important for unit tests and other tests that can be automated, such as performance and security tests https://learn.microsoft.com/en-us/training/modules/configure-provision-environments/4-configure-automated-integration-functional-test-automation .
- Shift-Left Testing: Incorporate testing early in the development process. This approach helps to catch defects earlier, when they are less expensive to fix https://learn.microsoft.com/en-us/training/modules/configure-provision-environments/4-configure-automated-integration-functional-test-automation .
- Test at the Lowest Level Possible: Write tests at the lowest level that makes sense to catch issues early and reduce the need for more complex tests like UI tests https://learn.microsoft.com/en-us/training/modules/configure-provision-environments/4-configure-automated-integration-functional-test-automation .
- Test Ownership: The responsibility for writing and maintaining tests should follow the ownership of the product code https://learn.microsoft.com/en-us/training/modules/configure-provision-environments/4-configure-automated-integration-functional-test-automation .
- Test in Production-like Environments: Ensure that tests run in an environment that closely resembles production to catch environment-specific issues https://learn.microsoft.com/en-us/training/modules/configure-provision-environments/4-configure-automated-integration-functional-test-automation .
For additional information on testing strategies and best practices, you can refer to the following resources:
- Agile Testing Quadrants for categorizing different types of tests: Agile Testing Quadrants https://learn.microsoft.com/en-us/training/modules/configure-provision-environments/4-configure-automated-integration-functional-test-automation .
- Information on Docker and containerization, which can be used to create consistent testing environments: Docker Overview.
- Azure Kubernetes Services (AKS) for orchestrating containerized applications, which can be part of a testing strategy for distributed systems: Introduction to AKS https://learn.microsoft.com/en-us/training/modules/design-container-build-strategy/1-introduction .
By following these guidelines and utilizing the provided resources, you can design and implement a testing strategy that ensures your software is tested thoroughly at every stage of development.
Design and implement build and release pipelines (40–45%)
Design and implement pipeline automation
Design and Implement UI Testing
User Interface (UI) testing is a critical component of the software development lifecycle, particularly in ensuring that applications meet their intended design and functionality requirements. UI testing involves the validation of the graphical interface part of an application. It checks that the UI elements such as buttons, text boxes, dropdowns, fonts, colors, and layouts behave as expected when interacted with.
Running UI Tests as a Service or Interactive Process
When setting up UI tests, it’s important to consider the context in which they will run. UI tests, such as Selenium or Coded UI tests, require a browser, which is launched in the context of the agent account. Therefore, the agent can be run as either a service or an interactive process, depending on the needs of the tasks running in your build and deployment jobs https://learn.microsoft.com/en-us/training/modules/manage-azure-pipeline-agents-pools/9-examine-other-considerations .
Interactive Mode: Initially, it’s recommended to run the agent in interactive mode to ensure it works correctly. For UI tests that require a browser, the agent may need to run interactively with autologon enabled, and the screen saver disabled. However, be aware of the security risks associated with enabling automatic login and disabling the screen saver https://learn.microsoft.com/en-us/training/modules/manage-azure-pipeline-agents-pools/9-examine-other-considerations .
Service Mode: For production use, running the agent as a service ensures that it reliably remains running and starts automatically if the machine is restarted. The service manager of the operating system can manage the lifecycle of the agent, and the experience for auto-upgrading the agent is better when it’s run as a service https://learn.microsoft.com/en-us/training/modules/manage-azure-pipeline-agents-pools/9-examine-other-considerations .
Rethinking Testing Strategy
Instead of converting all manual tests into automated UI tests, it’s essential to rethink the testing strategy. Agile testing suggests dividing tests into multiple categories, which can help in identifying which tests are suitable for automation and which are not https://learn.microsoft.com/en-us/training/modules/configure-provision-environments/4-configure-automated-integration-functional-test-automation .
Automatable Tests: Tests that are easy to automate or automated by nature, such as unit tests, component tests, and system or integration tests, should be automated. These typically fall into quadrants 1 and 4 of the Agile Testing Quadrants https://learn.microsoft.com/en-us/training/modules/configure-provision-environments/4-configure-automated-integration-functional-test-automation .
Shift-Left Testing: Tests that are harder to automate, such as exploratory tests, should be executed earlier in the development cycle, a practice known as shift-left. This approach emphasizes testing as close to the development process as possible https://learn.microsoft.com/en-us/training/modules/configure-provision-environments/4-configure-automated-integration-functional-test-automation .
Principles for Automated Testing
When designing and implementing UI testing, several principles should guide the automation strategy:
- Tests should be written at the lowest level possible to reduce the need for complex infrastructure or application deployments https://learn.microsoft.com/en-us/training/modules/configure-provision-environments/4-configure-automated-integration-functional-test-automation .
- Automated tests should be able to run anywhere, including the production system https://learn.microsoft.com/en-us/training/modules/configure-provision-environments/4-configure-automated-integration-functional-test-automation .
- The product should be designed for testability, making it easier to write and maintain tests https://learn.microsoft.com/en-us/training/modules/configure-provision-environments/4-configure-automated-integration-functional-test-automation .
- Test code should be treated with the same care as product code, ensuring only reliable tests are used https://learn.microsoft.com/en-us/training/modules/configure-provision-environments/4-configure-automated-integration-functional-test-automation .
- Test ownership should follow product ownership, with developers writing tests in the same language as the application code https://learn.microsoft.com/en-us/training/modules/configure-provision-environments/4-configure-automated-integration-functional-test-automation .
Tools and Execution
For UI testing, tools like Selenium, SpecFlow, or other specialized test tools can be used. These tools can be executed within the pipeline, and in some cases, you may need a Test agent to run the tests and report the results https://learn.microsoft.com/en-us/training/modules/configure-provision-environments/4-configure-automated-integration-functional-test-automation .
Security Considerations
Security is a crucial aspect of UI testing. Ensure that the testing environment and the tests themselves do not expose the application to security risks. Use best practices such as multifactor authentication (MFA) and role-based access control (RBAC) to protect the pipeline and the code https://learn.microsoft.com/en-us/training/modules/security-monitoring-and-governance/2-implement-pipeline-security .
Additional Resources
For more information on Agile Testing Quadrants, you can refer to Lisa Crispin’s work on the subject: - Agile Testing Quadrants: Lisa Crispin’s Agile Testing Quadrants https://learn.microsoft.com/en-us/training/modules/configure-provision-environments/4-configure-automated-integration-functional-test-automation .
For further reading on security best practices in DevOps, consider the following resources: - Just Enough Administration (JEA): Azure PowerShell JEA https://learn.microsoft.com/en-us/training/modules/security-monitoring-and-governance/2-implement-pipeline-security . - Open Web Application Security Project (OWASP): OWASP Foundation https://learn.microsoft.com/en-us/training/modules/security-monitoring-and-governance/2-implement-pipeline-security . - Microsoft Defender for Cloud: Microsoft Defender for Cloud https://learn.microsoft.com/en-us/training/modules/security-monitoring-and-governance/2-implement-pipeline-security .
By following these guidelines and utilizing the appropriate tools and practices, you can design and implement effective UI testing that contributes to the delivery of high-quality software.
Design and implement build and release pipelines (40–45%)
Design and implement pipeline automation
Implementing Orchestration of Tools: GitHub Actions and Azure Pipelines
Orchestration of tools in the context of DevOps refers to the coordination and management of automated tasks to streamline the software development process. Two prominent tools for this purpose are GitHub Actions and Azure Pipelines.
GitHub Actions
GitHub Actions is a powerful automation platform that enables developers to create custom software development life cycle (SDLC) workflows directly in their GitHub repository. With GitHub Actions, you can automate, customize, and execute your software development workflows right in your repository with workflows that are triggered by GitHub events.
Key Features: - Continuous Integration (CI): Automatically build and test your code as you commit changes to your repository https://learn.microsoft.com/en-us/training/modules/introduction-to-github-actions/1-introduction . - Environment Variables: Use environment variables to store and manage configuration options and secrets https://learn.microsoft.com/en-us/training/modules/learn-continuous-integration-github-actions/1-introduction . - Artifacts: Share artifacts between jobs in a workflow, such as binaries or test results https://learn.microsoft.com/en-us/training/modules/learn-continuous-integration-github-actions/1-introduction . - Secrets Management: Securely store and manage sensitive information like passwords, tokens, or SSH keys, which can be used within your pipelines https://learn.microsoft.com/en-us/training/modules/learn-continuous-integration-github-actions/8-create-encrypted-secrets . - Workflow Syntax: Define your workflows using the YAML syntax, which allows you to specify the triggers, jobs, steps, and actions https://learn.microsoft.com/en-us/training/modules/introduction-to-github-actions/5-describe-standard-workflow-syntax-elements .
For more information on GitHub Actions and workflow syntax, you can visit the official documentation: Workflow syntax for GitHub Actions https://learn.microsoft.com/en-us/training/modules/introduction-to-github-actions/5-describe-standard-workflow-syntax-elements .
Azure Pipelines
Azure Pipelines is a cloud service that you can use to automatically build and test your code project and make it available to other users. It works with just about any language or project type. Azure Pipiles combines continuous integration (CI) and continuous delivery (CD) to constantly and consistently test and build your code and ship it to any target.
Key Features: - Multi-Platform: Build, test, and deploy with CI/CD that works with any language, platform, and cloud. - Flexible Workflows: Create multi-stage CI/CD pipelines with approvals and gates. - Integration: Works well with Azure services, and also provides integration with other popular services. - Secure and Compliant: Azure Pipelines provides secure options for handling secrets and sensitive information, and is compliant with various standards.
For more information on Azure Pipelines, you can visit the official documentation: Azure Pipelines Documentation.
By implementing orchestration with GitHub Actions and Azure Pipelines, teams can automate their software delivery process, from code commits to production deployments, ensuring faster and more reliable releases.
Design and implement build and release pipelines (40–45%)
Design and implement a package management strategy
Designing a Package Management Implementation
When designing a package management implementation that incorporates Azure Artifacts, GitHub Packages, NuGet, and npm, it is essential to understand the role each component plays in the overall workflow. Below is a detailed explanation of how to integrate these services into a cohesive package management strategy.
Azure Artifacts
Azure Artifacts is a service that allows teams to share packages such as NuGet, npm, and Maven, among others, across their organization. It is deeply integrated with Azure DevOps, which streamlines the package management process within existing workflows https://learn.microsoft.com/en-us/training/modules/understand-package-management/10-package-management-azure-artifacts .
Key features of Azure Artifacts include:
- Organization and Sharing: Azure Artifacts helps keep artifacts organized and facilitates easy sharing by storing different package types together, such as Apache Maven, npm, and NuGet packages https://learn.microsoft.com/en-us/training/modules/software-composition-analysis/3-explore-software-composition-analysis .
- Security: It ensures the security of your packages by providing a safe feed for your Continuous Integration (CI) pipeline and protecting public source packages used by your team https://learn.microsoft.com/en-us/training/modules/software-composition-analysis/3-explore-software-composition-analysis .
- Integration: Azure Artifacts integrates seamlessly with Azure Pipelines, allowing for easy access to all artifacts in builds and releases https://learn.microsoft.com/en-us/training/modules/software-composition-analysis/3-explore-software-composition-analysis .
For more information about Azure Artifacts, you can visit the What are Azure Artifacts? page.
GitHub Packages
GitHub Packages is a package hosting service that allows you to host your software packages privately or publicly and use packages as dependencies in your projects. It supports several package management tools, including NuGet and npm, and integrates with GitHub Actions for CI/CD.
Key considerations for GitHub Packages:
- Version Control and Collaboration: GitHub Packages is tightly integrated with GitHub, providing version control and collaborative features for package development.
- Community and Discovery: Hosting packages on GitHub can increase visibility and facilitate discovery by the community, which can be beneficial for open-source projects.
NuGet
NuGet is a package manager for the Microsoft development platform, including .NET. It allows developers to create, share, and consume useful code. NuGet packages are .NET libraries that are packaged with all their dependencies and configuration.
Key aspects of NuGet:
- Package Restoration: NuGet restores packages when they are needed for a build, ensuring that all dependencies are available without storing them in source control.
- Feed Management: You can host your own NuGet feeds or use public repositories, and Azure Artifacts provides a feed for NuGet packages https://learn.microsoft.com/en-us/training/modules/software-composition-analysis/3-explore-software-composition-analysis .
npm
npm is the package manager for JavaScript and is widely used for managing dependencies in JavaScript projects. It allows you to install, share, and manage node modules.
Key features of npm:
- Large Registry: npm has a vast registry of JavaScript packages, making it an essential tool for modern web development.
- Scoped Packages: npm supports scoped packages, which can be public or private, allowing for fine-grained control over package distribution.
Implementation Steps
- Set Up Azure Artifacts: Create feeds in Azure Artifacts to host NuGet and npm packages. Ensure that the feeds are secured and accessible to your CI/CD pipelines https://learn.microsoft.com/en-us/training/modules/understand-package-management/10-package-management-azure-artifacts https://learn.microsoft.com/en-us/training/modules/software-composition-analysis/3-explore-software-composition-analysis .
- Configure GitHub Packages: Set up GitHub Packages to host your packages, configure access permissions, and integrate with GitHub Actions for automated workflows.
- Manage NuGet Packages: Use Azure Artifacts as your NuGet feed, and configure your development environment to restore packages from this feed during the build process https://learn.microsoft.com/en-us/training/modules/software-composition-analysis/3-explore-software-composition-analysis .
- Manage npm Packages: Similarly, configure npm to use Azure Artifacts as the primary source for npm packages, and set up authentication for private packages https://learn.microsoft.com/en-us/training/modules/software-composition-analysis/3-explore-software-composition-analysis .
- Integrate with CI/CD: Ensure that your CI/CD pipelines in Azure DevOps or GitHub Actions can access and restore packages from Azure Artifacts and GitHub Packages during the build and deployment processes.
By following these steps, you can design a robust package management implementation that leverages the strengths of Azure Artifacts, GitHub Packages, NuGet, and npm to streamline your development and deployment workflows.
Design and implement build and release pipelines (40–45%)
Design and implement a package management strategy
Design and Implement Package Feeds, Including Upstream Sources
When designing and implementing package feeds, it is essential to understand the role of feeds and upstream sources in managing and consuming packages for software development projects. Here’s a detailed explanation:
Understanding Package Feeds
Package feeds are endpoints in package management systems that serve as sources from which packages can be requested and installed into applications https://learn.microsoft.com/en-us/training/modules/understand-package-management/9-publish-packages . In Azure Artifacts, you can create multiple feeds within your projects. These feeds can be configured to be accessible either to users authorized within your project or to the entire organization https://learn.microsoft.com/en-us/training/modules/understand-package-management/9-publish-packages .
Public vs. Private Feeds
You must decide whether to use public, private, or a combination of both types of feeds for your solution https://learn.microsoft.com/en-us/training/modules/understand-package-management/8-introduction-to-azure-artifacts . Public package sources, such as nuget.org for NuGet packages, npmjs for npm packages, and pypi.org for Python packages, offer publicly available packages that can be freely consumed https://learn.microsoft.com/en-us/training/modules/understand-package-management/8-introduction-to-azure-artifacts https://learn.microsoft.com/en-us/training/modules/understand-package-management/5-explore-common-public-package-sources .
If your solution requires private packages that should not be publicly available, you will need to use a private feed https://learn.microsoft.com/en-us/training/modules/understand-package-management/8-introduction-to-azure-artifacts . Private feeds offer controlled access to packages, ensuring that only authorized users can consume them.
Upstream Sources
Upstream sources are package sources that a feed can pull packages from. Azure Artifacts allows feeds to specify one or more upstream sources, which can be public package sources or other private feeds https://learn.microsoft.com/en-us/training/modules/understand-package-management/8-introduction-to-azure-artifacts . This feature enables you to manage dependencies across multiple feeds efficiently and ensures that the latest versions of packages are available for consumption.
Creating a Feed
When creating a feed, consider the types of packages you will be managing. It is recommended to create one feed per package type to maintain clarity and organization within your feeds https://learn.microsoft.com/en-us/training/modules/understand-package-management/9-publish-packages . Each feed can contain mixed package types, but having a dedicated feed for each type simplifies management and usage.
Managing Feed Security
Each feed can manage its security settings, allowing you to control who has access to the feed and its packages https://learn.microsoft.com/en-us/training/modules/understand-package-management/9-publish-packages . This is crucial for private feeds where you need to ensure that only authorized users within your organization can access and consume the packages.
Developer Workflow
The typical developer workflow for consuming packages includes identifying dependencies, finding the right components, searching package sources for the correct version, installing the package, and implementing the software using the new components https://learn.microsoft.com/en-us/training/modules/understand-package-management/7-consume-packages . Package managers facilitate this process by helping to search for and install packages from the configured sources.
Configuring Package Sources
To consume packages from a feed, you need to specify the package source in your package manager. While package managers have a default source, you may need to configure additional feeds to consume packages from them https://learn.microsoft.com/en-us/training/modules/understand-package-management/7-consume-packages .
Additional Resources
For more information on package feeds and upstream sources, refer to the following URLs: - Azure Artifacts documentation: Azure Artifacts Documentation - NuGet Gallery: https://nuget.org - npmjs: https://npmjs.org - Python Package Index: https://pypi.org
By understanding and implementing package feeds and upstream sources, you can streamline the package management process, ensuring that your development team has access to the necessary dependencies for building and deploying applications.
Design and implement build and release pipelines (40–45%)
Design and implement a package management strategy
Dependency Versioning Strategy for Code Assets and Packages
When designing and implementing a dependency versioning strategy for code assets and packages, it is crucial to establish a system that clearly communicates changes and compatibility. Two common approaches to versioning are semantic versioning and date-based versioning.
Semantic Versioning
Semantic versioning, often abbreviated as SemVer, is a widely adopted versioning scheme that conveys meaning about the underlying changes in a release. It uses a three-part version number: Major, Minor, and Patch, as well as optional labels for pre-release and build metadata.
- Major version changes indicate incompatible API changes. When you make incompatible changes to your code, increment this number.
- Minor version changes add functionality in a backward-compatible manner. These are typically feature enhancements that do not break existing consumers of the package.
- Patch version changes are for backward-compatible bug fixes. This number is incremented when you make bug fixes that do not affect the package’s functionality or features.
An example of a semantic version is 2.3.1 where
2 is the major version, 3 is the minor
version, and 1 is the patch version.
For pre-release versions, labels such as alpha,
beta, or rc (release candidate) can be
appended to the version number, like 2.3.1-beta. These
indicate that the version is unstable and might not satisfy the intended
compatibility requirements as denoted by its associated normal
version.
For more information on semantic versioning, refer to the Semantic Versioning 2.0.0 specification https://learn.microsoft.com/en-us/training/modules/implement-versioning-strategy/3-explore-semantic-versioning .
Date-Based Versioning
Date-based versioning is another strategy where the version number is
derived from the date of the release. This can be the full date or a
part of it, such as the year and month. For example, a release made in
April 2023 might have a version number like 2023.04.
This approach does not inherently communicate changes in compatibility or functionality but can be useful for documentation and understanding when a particular version was released. It is often used in conjunction with semantic versioning, where the date may be included as build metadata.
Implementing the Strategy
When implementing a versioning strategy, consider the following best practices:
- Immutability of Published Packages: Once a package is published, it should not be altered. Any changes should result in a new version.
- Versioning Strategy: A clear versioning strategy should be in place to manage updates to packages effectively. This includes deciding when and how version numbers are incremented https://learn.microsoft.com/en-us/training/modules/understand-package-management/9-publish-packages .
- Package Promotion: Properly manage the lifecycle of packages, including the promotion of packages through different stages of development, testing, and production.
- Version Specification: Codebases should specify the exact versions of packages they depend on to avoid unexpected changes due to updates.
- Lifecycle and Change Rate: Understand that each package has its lifecycle and rate of change, which should be considered when versioning https://learn.microsoft.com/en-us/training/modules/implement-versioning-strategy/1-introduction .
By adhering to these principles, you can ensure that your dependency versioning strategy is robust, clear, and maintains the integrity of your codebase.
For additional details on versioning strategies and best practices, you can explore the following resources: - Implementing a Versioning Strategy https://learn.microsoft.com/en-us/training/modules/implement-versioning-strategy/1-introduction - Best Practices for Versioning https://learn.microsoft.com/en-us/training/modules/implement-versioning-strategy/1-introduction - [Package Promotion and Versioning] - [Understanding Software Changes and Versioning] https://learn.microsoft.com/en-us/training/modules/implement-versioning-strategy/1-introduction - [Semantic Versioning 2.0.0] https://learn.microsoft.com/en-us/training/modules/implement-versioning-strategy/3-explore-semantic-versioning
Please note that the URLs provided are for reference purposes and are part of the study materials.
Design and implement build and release pipelines (40–45%)
Design and implement a package management strategy
Design and Implement a Versioning Strategy for Pipeline Artifacts
When designing and implementing a versioning strategy for pipeline artifacts, it is essential to establish a systematic approach that ensures clarity, consistency, and control over the artifacts produced during the Continuous Integration (CI) and Continuous Deployment (CD) processes. Here are the key steps and best practices to consider:
Implement a Versioning Scheme
- Adopt Semantic Versioning (SemVer) 2.0: Semantic Versioning is a widely accepted system that uses a three-part version number: major, minor, and patch (e.g., 1.4.2). Each part has specific meanings related to compatibility and changes in the software. Adopting SemVer 2.0 helps communicate the nature of changes to users https://learn.microsoft.com/en-us/training/modules/implement-versioning-strategy/7-explore-best-practices-for-versioning .
- Document Your Versioning Strategy: Ensure that your versioning strategy is well-documented and understood by all team members. This documentation should include the versioning scheme, the circumstances under which version numbers are incremented, and the process for versioning artifacts https://learn.microsoft.com/en-us/training/modules/implement-versioning-strategy/7-explore-best-practices-for-versioning .
Promote Packages
- Use Promotion Flow: Implement a promotion flow for your packages, where artifacts are moved through different stages (e.g., development, testing, staging, production) and are versioned accordingly. This helps in tracking the maturity of the artifacts and ensures that only verified artifacts are deployed to production environments https://learn.microsoft.com/en-us/training/modules/implement-versioning-strategy/1-introduction .
Push Packages from Pipeline
- Automate Package Publishing: Configure your CI/CD pipeline to automatically publish packages back to the feed upon creation. This ensures that the latest artifacts are always available for deployment and reduces manual errors https://learn.microsoft.com/en-us/training/modules/implement-versioning-strategy/7-explore-best-practices-for-versioning .
Best Practices for Versioning
- Single Feed Reference: Ensure that each repository references only one feed to avoid confusion and maintain consistency across your development environment https://learn.microsoft.com/en-us/training/modules/implement-versioning-strategy/7-explore-best-practices-for-versioning .
- Versioning Strategy as Part of Definition of Done: Incorporate the versioning strategy into the Definition of Done for work items. This ensures that the versioning practices are adhered to before a work item is considered complete https://learn.microsoft.com/en-us/training/modules/implement-versioning-strategy/7-explore-best-practices-for-versioning .
Tools and Services
- Azure Artifacts: Utilize Azure Artifacts to organize and share access to your packages. Azure Artifacts supports multiple package types and integrates seamlessly with Azure Pipelines, providing a robust solution for artifact versioning and management https://learn.microsoft.com/en-us/training/modules/software-composition-analysis/3-explore-software-composition-analysis .
- Azure Blueprints: In scenarios where compliance and traceability are crucial, Azure Blueprints can be used to associate blueprints with specific build artifacts and release pipelines, ensuring that the versioning strategy aligns with security and compliance requirements https://learn.microsoft.com/en-us/training/modules/security-monitoring-and-governance/9-explore-azure-blueprints .
Additional Resources
For more information on implementing a versioning strategy and best practices, you can refer to the following resources: - What are Azure Artifacts? https://learn.microsoft.com/en-us/training/modules/software-composition-analysis/3-explore-software-composition-analysis - Azure Blueprints https://learn.microsoft.com/en-us/training/modules/security-monitoring-and-governance/9-explore-azure-blueprints - Best practices for using Azure Artifacts https://learn.microsoft.com/en-us/training/modules/implement-versioning-strategy/7-explore-best-practices-for-versioning
By following these guidelines and utilizing the appropriate tools, you can design and implement an effective versioning strategy for your pipeline artifacts, ensuring that your development process is efficient, reliable, and compliant with industry standards.
Design and implement build and release pipelines (40–45%)
Design and implement pipelines
Selecting a Deployment Automation Solution: GitHub Actions and Azure Pipelines
When choosing a deployment automation solution, it’s essential to understand the capabilities and features of the available tools. Two popular options are GitHub Actions and Azure Pipelines. Below is a detailed explanation of each, to help you make an informed decision.
GitHub Actions
GitHub Actions is a powerful automation platform that integrates directly with GitHub repositories. It enables the creation of workflows to automate the software development lifecycle, from testing to deployment.
Key Features:
- Workflow Automation: GitHub Actions can automate processes such as CI/CD, issue responses, code reviews, and branch management.
- YAML Syntax: Workflows are defined using YAML syntax and are stored within the repository, ensuring version control and easy access.
- Runners: Actions run on virtual environments called “runners,” which can be hosted by GitHub or self-hosted, providing flexibility in execution environments https://learn.microsoft.com/en-us/training/modules/introduction-to-github-actions/2-what-are-actions .
- Marketplace: A wide range of pre-built actions is available in the GitHub Marketplace, which can be used as-is or customized for specific workflows https://learn.microsoft.com/en-us/training/modules/introduction-to-github-actions/2-what-are-actions .
- Events and Scheduling: Workflows can be triggered by various GitHub events, cron schedules, or even manually, offering a high degree of control over when automation occurs.
- Secrets Management: Sensitive information such as passwords or keys can be securely stored and used within pipelines as “Secrets” https://learn.microsoft.com/en-us/training/modules/learn-continuous-integration-github-actions/8-create-encrypted-secrets .
For more information on GitHub Actions, visit the GitHub Marketplace.
Azure Pipelines
Azure Pipelines is a cloud service offered by Microsoft as part of Azure DevOps. It provides CI/CD capabilities that work with any language, platform, and cloud.
Key Features:
- Pre-built Runbooks: Azure Automation offers runbooks that have been pre-built by Microsoft and the community, which can be used as-is or modified to fit your needs https://learn.microsoft.com/en-us/training/modules/explore-azure-automation-devops/5-explore-runbook-gallery .
- Integration with Azure Services: Azure Pipelines is designed to work seamlessly with other Azure services and provides native support for deploying to Azure environments.
- Cross-platform Support: It supports a range of operating systems, including Windows, Linux, and macOS, and can build and deploy applications written in various programming languages.
- Extensibility: You can import runbooks from the Azure Automation GitHub repository, allowing you to leverage community contributions and extend functionality https://learn.microsoft.com/en-us/training/modules/explore-azure-automation-devops/5-explore-runbook-gallery .
- Az PowerShell Module: Azure Pipelines supports the Az PowerShell module, which is the recommended module for interacting with Azure and replaces the older AzureRM module https://learn.microsoft.com/en-us/training/modules/explore-azure-automation-devops/5-explore-runbook-gallery .
For more information on Azure Pipelines and the Az PowerShell module, refer to Introducing the new Azure PowerShell Az module.
Conclusion
Both GitHub Actions and Azure Pipelines offer robust solutions for deployment automation. Your choice may depend on factors such as the existing ecosystem (GitHub vs. Azure), the need for specific integrations, and the preference for hosted versus self-hosted runners. Consider the features and capabilities of each tool to select the one that best fits your project’s requirements.
Design and implement build and release pipelines (40–45%)
Design and implement pipelines
Design and Implement an Agent Infrastructure
When designing and implementing an agent infrastructure, several key considerations must be taken into account to ensure that the system is cost-effective, well-integrated with the necessary tools, properly licensed, connected, and maintainable. Below is a detailed explanation of these considerations:
Cost
The cost of setting up an agent infrastructure can vary widely depending on the scale and requirements of the project. Microsoft-hosted agents are provided by Azure Pipelines and can be an easy way to run jobs without configuring build infrastructure, which may reduce initial setup costs https://learn.microsoft.com/en-us/training/modules/manage-azure-pipeline-agents-pools/5-explore-predefined-agent-pool . However, for larger or more specialized needs, self-hosted agents might be more cost-effective in the long run, especially if existing infrastructure can be utilized https://learn.microsoft.com/en-us/training/modules/manage-azure-pipeline-agents-pools/1-introduction .
Tool Selection
Choosing the right tools is crucial for the success of the agent infrastructure. Microsoft-hosted agents come with a range of pre-installed software and virtual machine images, such as Windows Server with Visual Studio, Ubuntu, and macOS https://learn.microsoft.com/en-us/training/modules/manage-azure-pipeline-agents-pools/5-explore-predefined-agent-pool . For self-hosted agents, the selection of tools will depend on the specific needs of the build and deployment jobs. It’s important to ensure that the chosen tools are compatible and can be integrated into the Azure Pipelines environment.
Licenses
Licensing must be considered when selecting tools and setting up agents. Microsoft-hosted agents are available to all contributors in a project by default, which simplifies the licensing process https://learn.microsoft.com/en-us/training/modules/manage-azure-pipeline-agents-pools/5-explore-predefined-agent-pool . For self-hosted agents, you must ensure that all software running on the agents is properly licensed, and that the licenses allow for the intended use within the build and deployment processes.
Connectivity
Connectivity is a key factor in the design of an agent infrastructure. Agents must be able to communicate with Azure Pipelines and any external services required by the build and deployment jobs. When running an agent as a service or interactively, the account used to run the agent must have the necessary access to these services https://learn.microsoft.com/en-us/training/modules/manage-azure-pipeline-agents-pools/9-examine-other-considerations .
Maintainability
Maintainability of the agent infrastructure includes considerations such as ease of updates and the ability to troubleshoot issues. Microsoft updates the agent software every few weeks, and minor version updates are handled automatically by Azure Pipelines https://learn.microsoft.com/en-us/training/modules/manage-azure-pipeline-agents-pools/9-examine-other-considerations . For major version updates or interactive agents, manual intervention is required. It’s important to have a process in place for keeping agents up-to-date and for monitoring their health and performance.
For additional information on specifying pools for jobs, see the documentation on specifying pools for jobs https://learn.microsoft.com/en-us/training/modules/manage-azure-pipeline-agents-pools/5-explore-predefined-agent-pool . To learn more about the capabilities and management of Azure Pipelines Agents, refer to the Azure Pipelines documentation https://learn.microsoft.com/en-us/training/modules/manage-azure-pipeline-agents-pools/9-examine-other-considerations .
By carefully considering these aspects, you can design an agent infrastructure that is efficient, reliable, and scalable, meeting the needs of your development and deployment workflows.
Design and implement build and release pipelines (40–45%)
Design and implement pipelines
Develop and Implement Pipeline Trigger Rules
Pipeline triggers are essential for automating the deployment process in a CI/CD workflow. They define the conditions under which the pipeline will automatically start its execution. Understanding how to develop and implement pipeline trigger rules is crucial for maintaining an efficient and consistent deployment process.
Types of Pipeline Triggers
Continuous Deployment Trigger: This trigger automatically starts a deployment when a new build is available. It is commonly used to ensure that the latest version of the code is deployed to a testing or production environment as soon as it passes the build stage https://learn.microsoft.com/en-us/training/modules/explore-release-strategy-recommendations/2-understand-delivery-cadence-three-types-of-triggers .
Manual Trigger: As the name suggests, a manual trigger requires a user to manually initiate the pipeline. This is useful for deployments that require a final review or for when specific conditions must be met before deployment https://learn.microsoft.com/en-us/training/modules/explore-release-strategy-recommendations/9-knowledge-check .
Scheduled Trigger: Scheduled triggers allow deployments to occur at predefined times. This can be useful for off-peak hours deployments or periodic updates.
Pull Request Trigger: This trigger starts a pipeline when a pull request is created or updated. It is often used to validate changes before they are merged into the main branch.
Implementing Trigger Rules
To implement trigger rules, you need to configure your pipeline settings to specify when and how the pipeline should be triggered. For example, in Azure DevOps, you can set up a continuous deployment trigger in your release pipeline to initiate a deployment every time a build completes and a new release is created https://learn.microsoft.com/en-us/training/modules/explore-release-strategy-recommendations/2-understand-delivery-cadence-three-types-of-triggers .
Preventing Unwanted Deployments
Sometimes, it’s necessary to prevent a deployment if certain conditions are not met, such as failing compliance checks by a security testing tool. In Azure DevOps, you can use Release Gates to halt the deployment process until the specified conditions are satisfied. Release Gates can be configured to check for various criteria, including security scan results, before allowing the deployment to proceed https://learn.microsoft.com/en-us/training/modules/explore-release-strategy-recommendations/9-knowledge-check .
Pipeline Stages and Checks
A pipeline can be divided into stages, which are logical boundaries at which you can pause the pipeline and perform various checks. This allows for a more controlled and secure deployment process. At each stage, you can implement different trigger rules and checks to ensure that the deployment meets your standards https://learn.microsoft.com/en-us/training/modules/explore-release-strategy-recommendations/9-knowledge-check .
Additional Resources
For more information on setting up pipeline triggers and implementing pipeline rules in Azure DevOps, you can refer to the official Azure DevOps documentation: - Configure release triggers - Release Gates - Azure DevOps - Continuous Integration and Continuous Delivery (CI/CD)
By understanding and implementing pipeline trigger rules, you can ensure that your deployment process is both automated and secure, adhering to the best practices of DevOps.
Design and implement build and release pipelines (40–45%)
Design and implement pipelines
Develop Pipelines: Classic and YAML
When developing pipelines for continuous integration (CI) and continuous deployment (CD), there are two primary types of Azure DevOps pipelines that you can use: classic pipelines and YAML pipelines.
Classic Pipelines
Classic pipelines are created through a visual designer interface within Azure DevOps. This approach is user-friendly and does not require writing code. You can configure the entire pipeline by selecting pre-defined tasks and setting them up through the UI. This method is beneficial for those who prefer a graphical approach to pipeline configuration.
To set up a classic pipeline, you need to: 1. Navigate to your Azure DevOps project. 2. Go to the Pipelines section and create a new pipeline. 3. Use the visual designer to add tasks and configure build or release processes. 4. Define triggers, variables, and agent pools through the UI.
Classic pipelines are stored as a JSON file in Azure DevOps but are not typically version-controlled alongside your code.
YAML Pipipelines
YAML pipelines, on the other hand, are defined in a YAML file, which allows you to describe your pipeline as code. This method enables you to version control your pipeline definition alongside your application code, facilitating better collaboration and history tracking.
To create a YAML pipeline, you should: 1. Write a YAML file that describes your build and deployment steps. 2. Check this file into your version control repository. 3. In Azure DevOps, create a new pipeline and point it to the YAML file in your repository. 4. The pipeline will execute based on the definitions in the YAML file.
YAML pipelines provide more flexibility and control, and they support the concept of infrastructure as code (IaC), which is a best practice in DevOps.
Additional Resources
For more information on setting up and configuring Azure DevOps pipelines, you can refer to the following resources: - Azure DevOps documentation https://learn.microsoft.com/en-us/training/modules/create-release-pipeline/1-introduction . - Create an Azure DevOps organization https://learn.microsoft.com/en-us/training/modules/plan-agile-github-projects-azure-boards/9-agile-plan-portfolio-management-azure-boards https://learn.microsoft.com/en-us/training/modules/design-container-build-strategy/8-deploy-docker-containers-to-azure-app-service-web-apps . - Azure Pipelines for VS Code extension https://learn.microsoft.com/en-us/training/modules/create-release-pipeline/1-introduction . - Azure DevOps-supported browsers https://learn.microsoft.com/en-us/training/modules/plan-agile-github-projects-azure-boards/9-agile-plan-portfolio-management-azure-boards https://learn.microsoft.com/en-us/training/modules/design-container-build-strategy/8-deploy-docker-containers-to-azure-app-service-web-apps .
By understanding the differences between classic and YAML pipelines and leveraging the resources provided, you can develop effective CI/CD pipelines that align with your team’s workflow and project requirements.
Design and implement build and release pipelines (40–45%)
Design and implement pipelines
Design and Implement a Strategy for Job Execution Order, Including Parallelism and Multi-Stage
When designing a strategy for job execution order in CI/CD pipelines, it is crucial to understand the concepts of parallelism and multi-stage execution to optimize workflow efficiency and resource utilization.
Parallelism
By default, workflows are designed to run multiple jobs in parallel. This means that as soon as a workflow is triggered, all jobs within it start executing simultaneously, provided there are enough runners available. Parallel execution is beneficial when jobs are independent of each other, as it reduces the overall execution time of the workflow.
Example of parallel jobs in a workflow:
jobs:
  job1:
    runs-on: ubuntu-latest
    steps:
      - run: ./execute_test_suite_A.sh
  job2:
    runs-on: ubuntu-latest
    steps:
      - run: ./execute_test_suite_B.sh
In the above example, job1 and job2 will
run at the same time on separate runners https://learn.microsoft.com/en-us/training/modules/introduction-to-github-actions/7-explore-jobs
.
Multi-Stage Execution
Multi-stage execution refers to the process where jobs are executed in a specific sequence, often with dependencies between them. This is necessary when the output or success of one job is a prerequisite for the start of another.
To implement dependencies, you can use the needs keyword
to specify which jobs must complete successfully before the current job
can run.
Example of multi-stage jobs with dependencies:
jobs:
  setup:
    runs-on: ubuntu-latest
    steps:
      - run: ./setup_environment.sh
  build:
    needs: setup
    runs-on: ubuntu-latest
    steps:
      - run: ./build_application.sh
  deploy:
    needs: build
    runs-on: ubuntu-latest
    steps:
      - run: ./deploy_to_production.sh
In this example, the build job will only start after the
setup job completes successfully, and the
deploy job will wait for the build job to
finish https://learn.microsoft.com/en-us/training/modules/introduction-to-github-actions/7-explore-jobs
.
Considerations for Job Execution Strategy
- Runner Availability: Ensure that there are enough runners to handle the parallel jobs. GitHub provides hosted runners, but for other languages or specific needs, Docker containers on Linux-based systems can be used https://learn.microsoft.com/en-us/training/modules/introduction-to-github-actions/8-explore-runners .
- Resource Management: Balance the load across runners to prevent bottlenecks and optimize resource usage.
- Job Duration Limits: Be aware of the maximum duration limits for jobs and workflows. For instance, a job on GitHub Actions can run for up to 6 hours, and a workflow can run for up to 72 hours https://learn.microsoft.com/en-us/training/modules/introduction-to-github-actions/8-explore-runners .
- Artifact Sharing: Artifacts can be shared between jobs in a workflow, which is useful for passing data or binaries from one stage to another.
- Environment Variables and Secrets: Utilize environment variables for dynamic configuration and manage secrets for sensitive data https://learn.microsoft.com/en-us/training/modules/learn-continuous-integration-github-actions/1-introduction .
For more detailed information on creating dependent jobs and managing complex workflows, you can refer to the GitHub documentation on Managing complex workflows https://learn.microsoft.com/en-us/training/modules/introduction-to-github-actions/7-explore-jobs .
In summary, designing a job execution strategy requires a clear understanding of the dependencies between jobs, the ability to leverage parallelism effectively, and the knowledge of the tools and features provided by the CI/CD platform being used.
Design and implement build and release pipelines (40–45%)
Design and implement pipelines
Develop Complex Pipeline Scenarios: Containerized Agents and Hybrid Environments
When developing complex pipeline scenarios, it’s essential to understand the role of containerized agents and hybrid environments in the automation and deployment process.
Containerized Agents
Containerized agents are a method of packaging the tools and runtime required for build and release tasks in a container. This approach ensures consistency across environments, as the container includes the agent and all dependencies. It also allows for scalability, as containers can be quickly spun up or down based on demand.
Key benefits of using containerized agents include:
- Isolation: Each build or release task runs in its own container, reducing the risk of conflicts between different jobs.
- Consistency: The container image can be versioned and includes all dependencies, ensuring that the agent behaves the same way every time it’s used.
- Efficiency: Containers can start quickly and use fewer resources than virtual machines, leading to faster build times and cost savings.
For more information on containerized agents, you can refer to the documentation on Azure Pipelines.
Hybrid Environments
Hybrid environments refer to a setup where some infrastructure components are on-premises, and others are in the cloud. In the context of Azure DevOps, a Hybrid Runbook Worker can be used to execute runbooks directly within your on-premises environment, allowing you to manage resources in both your datacenter and the cloud.
Characteristics of the Hybrid Runbook Worker include:
- Flexibility: Runbooks can be executed on-premises or in the cloud, depending on where the resources are located.
- High Availability: Multiple agents can be installed in a group for redundancy.
- Security: There are no inbound firewall requirements; only outbound internet access is needed.
- Ease of Management: Agents are organized into pools, which can be shared across projects within an organization.
To configure on-premises servers to support the Hybrid Runbook Worker role with Desired State Configuration (DSC), they must be added as DSC nodes. This ensures that the desired state is maintained across all managed nodes.
For detailed guidance on installing and configuring Hybrid Runbook Workers, please visit the following resources:
- Automate resources in your datacenter or cloud by using Hybrid Runbook Worker.
- Onboarding machines for management by Azure Automation State Configuration.
- Hybrid Management in Azure Automation https://learn.microsoft.com/en-us/training/modules/explore-azure-automation-devops/10-explore-hybrid-management .
Conclusion
Understanding containerized agents and hybrid environments is crucial for developing complex pipeline scenarios. These concepts enable organizations to create robust, scalable, and consistent automation workflows that span across on-premises and cloud environments. By leveraging Azure DevOps and Azure Automation tools, teams can achieve more efficient and reliable deployments in their hybrid infrastructure https://learn.microsoft.com/en-us/training/modules/security-monitoring-and-governance/9-explore-azure-blueprints .
Design and implement build and release pipelines (40–45%)
Design and implement pipelines
Configure and Manage Self-Hosted Agents
When setting up Azure DevOps pipelines, you have the option to use Microsoft-hosted agents or configure self-hosted agents. Self-hosted agents are particularly useful when you need more control over the tools, scripts, and environment that the agent runs in. Below are the steps and considerations for configuring and managing self-hosted agents, including the use of virtual machine (VM) templates and containerization.
Setting Up Self-Hosted Agents
Assessing Resource Consumption: Determine if your jobs are suitable for running on self-hosted agents. Jobs that don’t consume many shared resources, such as those orchestrating deployments, are good candidates. However, jobs that require significant disk and I/O resources may not benefit much from being on the same machine https://learn.microsoft.com/en-us/training/modules/manage-azure-pipeline-agents-pools/9-examine-other-considerations .
Handling Singleton Tools: Be cautious with tools that are singletons, like npm packages. Parallel jobs on the same agent might interfere with each other, leading to unreliable results https://learn.microsoft.com/en-us/training/modules/manage-azure-pipeline-agents-pools/9-examine-other-considerations .
VM Templates: For consistency and scalability, create VM templates with the necessary configurations and tools pre-installed. This ensures that new agents can be spun up quickly and are ready to handle builds and deployments.
Containerization: Utilize containers to package the agent and its dependencies. This allows for a clean, isolated environment for each job, reducing the risk of conflicts between jobs and simplifying the process of updating tools and dependencies.
Agent Connectivity: Ensure that the agent has the required connectivity to the deployment targets. For example, if deploying to on-premises servers, the agent needs a “line of sight” to these servers. Microsoft-hosted agents have default connectivity to Azure services, but self-hosted agents might need additional network configuration https://learn.microsoft.com/en-us/training/modules/manage-azure-pipeline-agents-pools/8-communicate-to-deploy-to-target-servers .
Security: Secure your agents and pools by following best practices, such as running agents with least privilege and securing communication channels.
Additional Resources
- For detailed instructions on setting up self-hosted Windows agents, visit Self-hosted Windows agents.
- If you need to run a self-hosted agent behind a web proxy, refer to Run a self-hosted agent behind a web proxy.
- To learn about specifying pools for jobs, check out specifying pools for jobs.
By following these guidelines, you can effectively configure and manage self-hosted agents to meet the specific needs of your build and deployment processes. Remember to regularly review and update your VM templates and container configurations to keep up with the evolving requirements of your pipelines.
Design and implement build and release pipelines (40–45%)
Design and implement pipelines
Reusable Pipeline Elements in Azure DevOps
In Azure DevOps, creating reusable pipeline elements is essential for efficient and consistent automation of build and deployment processes. These elements include YAML templates, task groups, variables, and variable groups, which can be leveraged to streamline the pipeline creation and maintenance. Below is a detailed explanation of each element:
YAML Templates
YAML templates allow you to define a reusable set of steps that can be included in multiple pipelines. This is particularly useful when you have a common set of steps that you want to use across several jobs or stages in different pipelines. By using templates, you can update a single template file, and the changes will propagate to all pipelines that reference it.
For additional information on YAML templates, you can visit: - YAML schema reference
Task Groups
Task groups encapsulate a sequence of tasks that you can reuse in multiple build or release pipelines. When you create a task group, you can abstract the parameters that vary across different pipelines, such as service connections or file paths, and expose them as inputs. This makes it easy to reuse complex sequences of tasks while providing the flexibility to customize the inputs for each pipeline.
For more details on task groups, refer to: - Task groups
Variables
Variables in Azure DevOps pipelines are key-value pairs that store data that can be used in your pipelines. They can be defined at various scopes such as pipeline, stage, job, or step, and can be set dynamically during pipeline execution. Variables can be used to manage environment-specific configurations, pass data between tasks, and control the flow of the pipeline.
To learn more about variables, check out: - Define variables
Variable Groups
Variable groups are collections of related variables that can be accessed across multiple pipelines. They are useful when you have a set of variables that you want to share and manage at a single place. Variable groups can be linked to Azure Key Vault, allowing you to securely store and manage secrets and certificates that your build and release pipelines can reference.
For further information on variable groups, you can visit: - Library - Variable groups
By utilizing these reusable pipeline elements, you can create more maintainable, scalable, and consistent Azure DevOps pipelines. This not only saves time but also reduces the potential for errors when setting up new pipelines or making changes to existing ones.
Design and implement build and release pipelines (40–45%)
Design and implement pipelines
Design and Implement Checks and Approvals Using YAML Environments
When designing and implementing checks and approvals in CI/CD pipelines, YAML environments play a crucial role in defining the workflow and ensuring that the deployment process adheres to the organization’s quality policies. Here’s a detailed explanation of how to design and implement checks and approvals using YAML environments:
YAML Environments
YAML (Yet Another Markup Language) is a human-readable data serialization standard that can be used to define CI/CD pipeline configurations. In the context of Azure DevOps, YAML files are used to create workflows that include steps, jobs, and environments.
Checks and Approvals
Checks and approvals are mechanisms to enforce control points within the pipeline to ensure that only code that meets certain criteria is deployed. These can be automated or manual and are defined within the YAML file.
Designing Checks
Checks are automated tests or criteria that the code must pass before it can be deployed to the next stage. Examples of checks include:
- Automated Testing: Ensuring that all unit tests pass before the code is deployed.
- Code Quality: Verifying that the code meets quality standards, such as no new blocker issues or a certain level of code coverage.
- Security Scans: Checking for vulnerabilities in dependencies or compliance with security policies.
Implementing Approvals
Approvals are manual interventions where a human must sign off on the deployment. In YAML, approvals can be implemented as:
- Pre-deployment Approvals: These are required before the deployment to an environment begins. They can be used to ensure that there are no active issues in the work item or problem management system https://learn.microsoft.com/en-us/training/modules/explore-release-strategy-recommendations/8-control-deployments-using-release-gates .
- Post-deployment Approvals: These occur after the deployment to an environment and before promoting the release to the next environment. They can be used to ensure there are no incidents from the app’s monitoring or incident management system https://learn.microsoft.com/en-us/training/modules/explore-release-strategy-recommendations/8-control-deployments-using-release-gates .
Using YAML for Environments
In the YAML workflow file, you can define environments and specify the checks and approvals for each. Here’s an example snippet:
jobs:
  - deployment: DeployWebApp
    displayName: Deploy Web App
    environment:
      name: production
      resourceType: VirtualMachine
    strategy:
      runOnce:
        deploy:
          steps:
          - script: echo Deploying to production!
In this example, the environment keyword is used to
specify the target environment for the deployment. The
strategy defines the deployment method, and the
steps outline the tasks to be executed.
Additional Information
For more details on environment variables, including a list of built-in environment variables, you can refer to the GitHub documentation on environment variables https://learn.microsoft.com/en-us/training/modules/learn-continuous-integration-github-actions/3-examine-environment-variables . Additionally, GitHub Actions can be used to automate workflows and can be defined in YAML within the GitHub repositories https://learn.microsoft.com/en-us/training/modules/introduction-to-github-actions/2-what-are-actions .
By carefully designing and implementing checks and approvals using YAML environments, you can create robust pipelines that ensure code quality and adhere to organizational policies before deployment.
Design and implement build and release pipelines (40–45%)
Design and implement deployments
Designing a Deployment Strategy
When designing a deployment strategy, it is crucial to understand the various methodologies that can be employed to ensure a smooth and controlled release process. Here, we will explore several deployment strategies that are commonly used in modern software development and operations.
Blue-Green Deployment
Blue-green deployment is a strategy that reduces downtime and risk by running two identical production environments. Only one of the environments, known as ‘Blue,’ is live at any given time, serving all production traffic. The other environment, ‘Green,’ is idle and updated with the new version of the application. Once the ‘Green’ environment is fully tested and ready to go live, the traffic is switched from ‘Blue’ to ‘Green’. If any issues arise, traffic can be quickly switched back to the ‘Blue’ environment.
Canary Deployment
Canary deployment involves rolling out the changes to a small subset of users before making them available to everybody. This approach allows teams to monitor the behavior of the updated application with a small, controlled group of users and catch any potential issues early. If the canary release performs well, it is then gradually rolled out to the rest of the user base.
Ring Deployment
Ring deployment is a strategy where the user base is segmented into different rings, each representing a group of users who receive updates at different stages. The first ring, often consisting of internal users, gets the update first. Subsequent rings receive the update once it’s proven stable in the previous ring. This approach helps in identifying issues in a controlled manner, minimizing the impact on the entire user base.
Progressive Exposure
Progressive exposure is similar to ring deployment but focuses on gradually increasing the exposure of the new version to users based on certain criteria, such as user demographics, region, or device type. This method allows for careful monitoring and quick rollback if necessary.
Feature Flags
Feature flags, also known as feature toggles, are a technique that allows developers to enable or disable features without deploying new code. This can be used to test new features with specific user segments or to enable/disable features dynamically in response to system performance or other criteria.
A/B Testing
A/B testing is a method of comparing two versions of an application against each other to determine which one performs better. It is a form of experimentation where two or more variants of a page are shown to users at random, and statistical analysis is used to determine which variation performs better for a given conversion goal.
Each of these strategies has its own set of advantages and can be chosen based on the specific needs of the deployment scenario. It is important to consider factors such as the complexity of the application, the criticality of the system, user tolerance for downtime, and the team’s ability to support the chosen strategy.
For additional information on deployment strategies, you can refer to the following resources: - Blue-Green Deployments - Canary Releases - Feature Flags - A/B Testing
Please note that the URLs provided are for additional context and learning purposes and are not meant to be included in the study guide as direct references.
Design and implement build and release pipelines (40–45%)
Design and implement deployments
When designing a pipeline to ensure the reliable order of dependency deployments, it is crucial to consider the sequence in which components are deployed to maintain the integrity and functionality of the application. Here are some strategies to achieve this:
Continuous Deployment Triggers
Continuous deployment triggers can be used to automatically start a deployment after a successful build. This ensures that the latest version of the application is deployed after each build, maintaining the order of deployments as per the build sequence.
- Enable Continuous Deployment: By enabling continuous deployment, you can ensure that every time a build completes, the deployment of the release pipeline will start automatically. This helps in maintaining the order of deployments as they are triggered by the completion of builds https://learn.microsoft.com/en-us/training/modules/explore-release-strategy-recommendations/3-exercise-select-your-delivery-deployment-cadence .
Self-Hosted Agents
Using self-hosted agents in Azure Pipelines gives you more control over the environment where your builds and deployments run. This is particularly useful when you have specific dependencies that need to be installed on the agent that runs your pipeline.
- Control Over Dependencies: By installing the agent on a machine (Linux, macOS, Windows, or Linux Docker containers), you can install any other software required by your build or deployment jobs. This ensures that the dependencies are available and in the correct order for your deployments https://learn.microsoft.com/en-us/training/modules/manage-azure-pipeline-agents-pools/2-choose-between-microsoft-hosted-versus-self-hosted-agents .
Release Gates
Release gates can be configured to control the execution of Azure Pipelines. They can be used to ensure that certain conditions are met before promoting a release to the next environment.
Pre-Deployment Gates: These gates can ensure that there are no active issues in the work item or problem management system before deploying a build to an environment. This helps in verifying that dependencies are resolved before deployment https://learn.microsoft.com/en-us/training/modules/explore-release-strategy-recommendations/8-control-deployments-using-release-gates .
Post-Deployment Gates: After deployment, post-deployment gates can ensure that there are no incidents from the app’s monitoring or incident management system. This allows for a phased deployment approach, ensuring that the application is stable before moving on to the next set of users https://learn.microsoft.com/en-us/training/modules/explore-release-strategy-recommendations/8-control-deployments-using-release-gates .
Software Composition Analysis
Software composition analysis (SCA) tools can be used to identify potential security vulnerabilities in open-source software (OSS) components before they are deployed.
- Analyzing OSS: By analyzing OSS, you can identify security vulnerabilities and ensure that the software meets the defined criteria for use in your pipeline. This helps in maintaining the order of secure and compliant deployments https://learn.microsoft.com/en-us/training/modules/software-composition-analysis/10-knowledge-check .
Additional Resources
For more information on these strategies, you can refer to the following URLs:
- Continuous Deployment Triggers: Continuous Deployment Trigger
- Self-Hosted Agents: Self-Hosted Agents in Azure Pipelines
- Release Gates: Configure Deployment Gates
- Software Composition Analysis: Mend Bolt
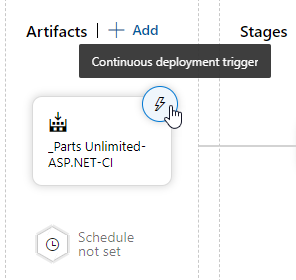
By incorporating these strategies into your pipeline design, you can ensure a reliable order of dependency deployments, which is essential for the stability and reliability of your application deployments.
Design and implement build and release pipelines (40–45%)
Design and implement deployments
Minimizing downtime during deployments is crucial to ensure that users experience no interruption in service. Here are strategies to achieve this:
Virtual IP Address (VIP) Swap
A Virtual IP (VIP) swap is a technique used to redirect traffic from a currently running production environment to a new deployment with minimal downtime. This is typically done in cloud services like Azure App Service, where you have a staging and a production slot. Once you have validated your application in the staging slot, you can swap it with the production slot, which redirects the traffic to the new version without downtime.
Load Balancer
A load balancer distributes incoming application traffic across multiple servers or instances. During deployments, a load balancer can redirect traffic away from the instances that are being updated to the ones that are still running the stable version of the application. Once the update is complete and the new instances are verified to be running correctly, the load balancer can gradually shift traffic to the updated instances.
Rolling Deployments
Rolling deployments involve updating a few instances at a time rather than all at once, which helps in minimizing downtime. This strategy is often used in conjunction with a load balancer. As each instance is updated, it is removed from the pool of servers that the load balancer directs traffic to. Once the update is complete and the instance is back online, it is re-added to the pool. This process is repeated until all instances are updated.
For more detailed information on these strategies, you can refer to the following resources: - Azure App Service deployment slots - Azure Load Balancer - Implementing rolling deployments in Azure
By implementing these strategies, organizations can ensure that their deployments have minimal impact on the end-users, providing a seamless experience even during updates and maintenance activities.
Design and implement build and release pipelines (40–45%)
Design and implement deployments
Designing a Hotfix Path Plan for High-Priority Code Fixes
When addressing high-priority code fixes, it is essential to have a well-defined hotfix path plan that ensures quick and reliable delivery of changes to the production environment. The following steps outline a strategy for designing such a plan:
Establish a Hotfix Policy: Define what constitutes a ‘high-priority’ fix. This could be based on the severity of the issue, the impact on users, or security implications. Ensure that the policy is well-documented and understood by all team members.
Hotfix Branch Strategy: Implement a branching strategy in your version control system that supports hotfixes. This typically involves maintaining a separate branch for hotfixes that can be deployed independently of the main development line.
Automated Testing: Integrate automated testing into your hotfix path to ensure that the fix does not introduce new issues. This should include unit tests, integration tests, and any other relevant automated tests.
Continuous Integration (CI) Pipeline: Utilize a CI pipeline to build and test the hotfix branch automatically. This helps in identifying integration issues early and speeds up the delivery process https://learn.microsoft.com/en-us/training/modules/create-release-pipeline/1-introduction .
Continuous Delivery (CD) Pipeline: Set up a CD pipeline for automated deployment of the hotfix to production. This should be triggered once the hotfix passes all automated tests and is approved for release https://learn.microsoft.com/en-us/training/modules/create-release-pipeline/1-introduction .
Incident Response Plan: Incorporate the hotfix process into your incident response plan. This ensures that when a high-priority issue is detected, the team knows how to respond and has the tools and permissions necessary to implement the fix quickly https://learn.microsoft.com/en-us/training/modules/security-monitoring-and-governance/4-examine-microsoft-defender-cloud-usage-scenarios .
Monitoring and Alerting: Implement monitoring and alerting tools to detect issues in real-time. This allows for prompt identification of problems that may require a hotfix.
Rollback Strategy: Have a plan in place for rolling back the hotfix if it causes unexpected issues in the production environment. This minimizes downtime and impact on users.
Post-Deployment Review: After deploying a hotfix, conduct a post-mortem analysis to understand the root cause of the issue and improve the hotfix path plan for future incidents.
Documentation and Communication: Document the hotfix process and communicate it to all stakeholders. This includes developers, operations teams, and support staff.
Security Considerations: Ensure that the hotfix does not compromise the security of the application. Use tools like Microsoft Defender for Cloud to assess and diagnose security issues that may arise during the hotfix process https://learn.microsoft.com/en-us/training/modules/security-monitoring-and-governance/4-examine-microsoft-defender-cloud-usage-scenarios .
Training: Provide training for the development and operations teams on the hotfix process, including how to use the CI/CD pipelines and incident response tools effectively.
For more information on implementing these practices, refer to the following resources:
- Azure DevOps documentation for setting up CI/CD pipelines: [Azure Boards documentation | Microsoft Docs] https://learn.microsoft.com/en-us/training/modules/plan-agile-github-projects-azure-boards/3-introduction-to-azure-boards .
- Microsoft Defender for Cloud for security monitoring and governance: Microsoft Defender for Cloud https://learn.microsoft.com/en-us/training/modules/security-monitoring-and-governance/4-examine-microsoft-defender-cloud-usage-scenarios .
- Azure DevOps for planning and tracking work across teams: [Reasons to start using Azure Boards | Microsoft Docs] https://learn.microsoft.com/en-us/training/modules/plan-agile-github-projects-azure-boards/3-introduction-to-azure-boards .
By following these steps and utilizing the provided resources, you can design a robust hotfix path plan that enables your team to respond swiftly and effectively to high-priority code fixes.
Design and implement build and release pipelines (40–45%)
Design and implement deployments
Implementing Load Balancing for Deployment
Load balancing is a critical component in deploying scalable and highly available applications. In Azure, there are several services that offer load balancing capabilities, including Azure Traffic Manager and the Web Apps feature of Azure App Service.
Azure Traffic Manager
Azure Traffic Manager is a DNS-based traffic load balancer that enables you to distribute traffic optimally to services across global Azure regions, while providing high availability and responsiveness.
- Traffic Routing Methods: Traffic Manager supports multiple traffic-routing methods to determine how to route network traffic to the various service endpoints. These include priority, weighted, geographic, and performance routing.
- Service Endpoint Monitoring: Traffic Manager continuously monitors the endpoint health and automatically directs users to the nearest available endpoint based on the chosen traffic-routing method.
- Failover Support: In the event of a failure, Traffic Manager can quickly failover to the next available endpoint without any disruption to the end user.
- Application Continuity: By using Traffic Manager, applications can run in a continuous and reliable manner, with the traffic manager handling the distribution of requests to ensure maximum performance and uptime.
For more information on Azure Traffic Manager, you can visit the official documentation: Azure Traffic Manager Documentation.
Web Apps Feature of Azure App Service
Azure App Service is a fully managed platform for building, deploying, and scaling web apps. The Web Apps feature of Azure App Service includes built-in load balancing that automatically distributes incoming application traffic across multiple instances of your web app.
- Auto-scaling: Azure App Service can automatically scale your web applications up or down based on demand or a set schedule, ensuring that your application can handle increases in traffic without manual intervention.
- Multiple Deployment Slots: With deployment slots, you can deploy different versions of your web app to different URLs such as staging or testing slots. This allows you to perform A/B testing and roll out updates in a controlled manner.
- Custom Domains and SSL: You can configure custom domains and secure your applications with SSL/TLS certificates, ensuring secure and professional-looking URLs for your web apps.
- Integration with Azure DevOps: Azure App Service integrates with Azure DevOps for continuous integration and deployment (CI/CD), allowing for streamlined updates and management of your applications.
For additional details on the Web Apps feature of Azure App Service, refer to the following resource: Azure App Service Documentation.
By leveraging Azure Traffic Manager and the Web Apps feature of Azure App Service, you can ensure that your applications remain highly available, maintain performance under varying loads, and provide a seamless experience to your users. These services are essential tools in implementing effective load balancing strategies for your deployments in Azure.
Design and implement build and release pipelines (40–45%)
Design and implement deployments
Implementing Feature Flags Using Azure App Configuration Feature Manager
Feature flags, also known as feature toggles or switches, are a powerful technique in modern software development that allows developers to turn features on or off without deploying new code. Implementing feature flags using Azure App Configuration Feature Manager involves several steps and considerations.
Centralized Feature Management
Azure App Configuration provides a centralized service for managing application settings and feature flags. This is particularly useful for applications with distributed components, such as microservices or serverless architectures, where managing configurations across different environments can be challenging https://learn.microsoft.com/en-us/training/modules/manage-application-configuration-data/5-introduction-to-azure-app-configuration .
Key Features of Azure App Configuration
- Fully Managed Service: Azure App Configuration is easy to set up and requires minimal management effort https://learn.microsoft.com/en-us/training/modules/manage-application-configuration-data/5-introduction-to-azure-app-configuration .
- Flexible Key Representations: It supports various key representations and mappings, making it adaptable to different application needs https://learn.microsoft.com/en-us/training/modules/manage-application-configuration-data/5-introduction-to-azure-app-configuration .
- Label Tagging: This feature allows for the organization and retrieval of configurations based on labels.
- Point-in-Time Replay: Azure App Configuration can replay settings to a specific point in time, which is useful for troubleshooting and rollbacks https://learn.microsoft.com/en-us/training/modules/manage-application-configuration-data/5-introduction-to-azure-app-configuration .
- Feature Flag UI: A dedicated user interface is provided for managing feature flags, simplifying the process of toggling features on or off https://learn.microsoft.com/en-us/training/modules/manage-application-configuration-data/5-introduction-to-azure-app-configuration .
- Configuration Comparison: It allows for the comparison of different sets of configurations based on custom-defined dimensions https://learn.microsoft.com/en-us/training/modules/manage-application-configuration-data/5-introduction-to-azure-app-configuration .
- Security: Enhanced security is provided through Azure managed identities and complete data encryption, both at rest and in transit https://learn.microsoft.com/en-us/training/modules/manage-application-configuration-data/5-introduction-to-azure-app-configuration .
- Native Framework Integration: Azure App Configuration integrates natively with popular frameworks, easing the implementation process https://learn.microsoft.com/en-us/training/modules/manage-application-configuration-data/5-introduction-to-azure-app-configuration .
Externalizing Feature Flags
To use feature flags effectively, they should be externalized from the application code. This means that the feature flags are stored outside the application, in a centralized repository like Azure App Configuration. This approach allows for changes to feature flags without the need to modify or redeploy the application https://learn.microsoft.com/en-us/training/modules/manage-application-configuration-data/7-examine-app-configuration-feature-management .
Storing and Managing Feature Flags
Azure App Configuration is designed to be the centralized repository for feature flags. It allows you to define and manipulate the states of feature flags quickly. The service stores configuration data as key-value pairs, which can be accessed by the application using App Configuration libraries for various programming languages https://learn.microsoft.com/en-us/training/modules/manage-application-configuration-data/7-examine-app-configuration-feature-management https://learn.microsoft.com/en-us/training/modules/manage-application-configuration-data/6-examine-key-value-pairs .
Filters for Feature Flags
Filters are rules that evaluate the state of a feature flag. They can represent various conditions such as user groups, device or browser types, geographic locations, and time windows. Effective feature management requires at least two components: an application that uses feature flags and a separate repository that stores the feature flags and their current states https://learn.microsoft.com/en-us/training/modules/manage-application-configuration-data/7-examine-app-configuration-feature-management .
Implementing Feature Flags
- Define Feature Flags: Create and define feature flags within Azure App Configuration, specifying the key-value pairs that represent the features you want to control.
- Apply Filters: Set up filters to control the conditions under which the feature flags are active or inactive.
- Integrate with Application: Use the App Configuration libraries to integrate the feature flags into your application code, allowing the application to query the current state of feature flags.
- Toggle Features: Use the Azure App Configuration UI to toggle feature flags on or off as needed, observing the changes in real-time without redeploying the application.
For additional information on Azure App Configuration and Feature Manager, you can refer to the official documentation provided by Microsoft:
- Azure App Configuration Documentation
- Quickstart for Azure App Configuration
- How to use feature flags in an application
By following these steps and utilizing the features provided by Azure App Configuration, developers can implement feature flags in a way that is secure, manageable, and scalable.
Design and implement build and release pipelines (40–45%)
Design and implement deployments
Implementing Application Deployment Using Containers, Binaries, and Scripts
Application deployment is a critical phase in the software development lifecycle. It involves the process of making an application available for use. One of the modern approaches to application deployment is through the use of containers, binaries, and scripts. Below is a detailed explanation of each method:
Containers
Containers encapsulate an application with its dependencies, libraries, and configuration files into a single package. This ensures that the application runs consistently across different computing environments.
Azure Container Instances (ACI): ACI allows for the deployment of containers without the need to manage the underlying infrastructure. It provides fast deployment and hypervisor isolation for security https://learn.microsoft.com/en-us/training/modules/design-container-build-strategy/7-explore-azure-container-related-services .
Azure Kubernetes Service (AKS): AKS is a managed Kubernetes service that simplifies the deployment, management, and scaling of containerized applications. It provides robust security features and integrates well with other Azure services https://learn.microsoft.com/en-us/training/modules/design-container-build-strategy/7-explore-azure-container-related-services .
Azure Container Registry (ACR): ACR is a private registry service for storing and managing container images. It supports all container deployments and integrates with Azure services for seamless DevOps workflows https://learn.microsoft.com/en-us/training/modules/design-container-build-strategy/7-explore-azure-container-related-services .
Azure Container Apps: This service enables the deployment of modern apps and microservices using serverless containers. It supports autoscaling and event-driven scaling through KEDA https://learn.microsoft.com/en-us/training/modules/design-container-build-strategy/7-explore-azure-container-related-services .
Binaries
Binaries are compiled code that can be executed directly by the computer’s operating system. Deploying applications as binaries involves:
Configuration Management: Managing the configuration of binaries is crucial. Configuration files often accompany binaries to dictate the application’s behavior. However, managing these configurations across multiple instances can be challenging https://learn.microsoft.com/en-us/training/modules/manage-application-configuration-data/2-rethink-application-configuration-data .
Deployment Scripts: Scripts can be used to automate the deployment of binaries. These scripts can handle tasks such as copying files, setting up services, and configuring the environment.
Scripts
Scripts are sets of commands that automate tasks. In deployment, scripts are used to:
Automate Deployment Processes: Scripts can automate the steps required to deploy an application, such as setting up the environment, starting services, and performing health checks.
Manage Configuration: Scripts can be used to modify configuration files or environment variables, ensuring that the application has the correct settings for the environment it is deployed in https://learn.microsoft.com/en-us/training/modules/manage-application-configuration-data/2-rethink-application-configuration-data .
Best Practices for Deployment
Phased Rollout: Deploy updates in a phased manner to monitor usage and performance before a full rollout. This can be managed using deployment gates in Azure Pipelines https://learn.microsoft.com/en-us/training/modules/explore-release-strategy-recommendations/8-control-deployments-using-release-gates .
Health Checks: Implement pre-deployment and post-deployment gates to ensure the application is healthy before and after deployment. This can include checking for active issues or monitoring alerts https://learn.microsoft.com/en-us/training/modules/explore-release-strategy-recommendations/8-control-deployments-using-release-gates .
Self-Hosted Agents: For more control over the deployment environment, use self-hosted agents in Azure Pipelines. This allows you to install any necessary software and manage dependencies for your builds and deployments https://learn.microsoft.com/en-us/training/modules/manage-azure-pipeline-agents-pools/2-choose-between-microsoft-hosted-versus-self-hosted-agents .
Additional Resources
- Azure Container Instances: ACI Information
- Azure Kubernetes Service: AKS Information
- Azure Container Registry: ACR Information
- Azure Container Apps: Azure Container Apps Information
- Distributed Application Runtime: Dapr
- Kubernetes Event-Driven Autoscaling: KEDA
- Azure App Service: Azure App Service Information
By understanding and utilizing these methods and services, you can implement a robust and efficient deployment process for your applications.
Design and implement build and release pipelines (40–45%)
Design and implement infrastructure as code (IaC)
Configuration Management Technology for Application Infrastructure
When selecting a configuration management technology for application infrastructure, it is essential to consider a solution that integrates well with the principles of Infrastructure as Code (IaC) and Continuous Delivery (CD). IaC is a key practice that allows for the automated creation and configuration of infrastructure through code, which can be version-controlled and reused https://learn.microsoft.com/en-us/training/modules/configure-provision-environments/2-provision-configure-target-environments .
Azure Resource Manager (ARM) is a robust configuration management tool that can be recommended for managing Azure-based application infrastructure. ARM templates allow you to define the infrastructure and dependencies for your applications in a declarative manner. These templates can be checked into source control, providing a history of changes and the ability to replicate environments reliably https://learn.microsoft.com/en-us/training/modules/security-monitoring-and-governance/2-implement-pipeline-security .
Azure Automation is another service that can be used for configuration management. It supports Desired State Configuration (DSC), which helps ensure that the components of your systems are in a specific, desired state. This is particularly useful for maintaining consistency across multiple deployment environments https://learn.microsoft.com/en-us/training/modules/security-monitoring-and-governance/2-implement-pipeline-security .
Azure App Configuration is a service that provides central management of application settings and feature flags. It is designed to complement Azure Key Vault, which stores application secrets. Azure App Configuration allows for the centralized management and distribution of configuration data and can dynamically change application settings without the need to redeploy or restart an application https://learn.microsoft.com/en-us/training/modules/manage-application-configuration-data/5-introduction-to-azure-app-configuration .
For containerized applications, Azure Kubernetes Service (AKS) can be used to manage container orchestration, which includes the deployment, scaling, and operations of application containers across clusters of hosts.
In summary, the recommended configuration management technologies for application infrastructure in Azure are:
- Azure Resource Manager (ARM): For defining infrastructure as code and provisioning Azure resources https://learn.microsoft.com/en-us/training/modules/security-monitoring-and-governance/2-implement-pipeline-security .
- Azure Automation and DSC: For ensuring the desired state of your infrastructure and automating configuration management tasks https://learn.microsoft.com/en-us/training/modules/security-monitoring-and-governance/2-implement-pipeline-security .
- Azure App Configuration: For central management of application settings and feature flags https://learn.microsoft.com/en-us/training/modules/manage-application-configuration-data/5-introduction-to-azure-app-configuration .
- Azure Kubernetes Service (AKS): For managing containerized applications and automating deployment, scaling, and operations.
For additional information on these services, you can visit the following URLs:
- Azure Resource Manager: ARM Templates
- Azure Automation: Azure Automation Documentation
- Azure App Configuration: Azure App Configuration Documentation
- Azure Kubernetes Service (AKS): AKS Documentation
By leveraging these technologies, you can achieve a high level of automation, consistency, and control over your application infrastructure, which is crucial for modern cloud-based environments.
Design and implement build and release pipelines (40–45%)
Design and implement infrastructure as code (IaC)
Implementing a Configuration Management Strategy for Application Infrastructure, Including Infrastructure as Code (IaC)
Infrastructure as Code (IaC) is a key practice within DevOps that involves managing and provisioning computing infrastructure through machine-readable definition files, rather than physical hardware configuration or interactive configuration tools. Implementing a configuration management strategy that includes IaC can significantly improve the consistency, reliability, and speed of infrastructure deployment and changes.
Key Concepts of IaC
- Automated Infrastructure Provisioning: IaC allows for the automated creation of servers and environments, which can be triggered on-demand as part of the release pipeline https://learn.microsoft.com/en-us/training/modules/configure-provision-environments/2-provision-configure-target-environments .
- Version Control Integration: Infrastructure definitions should be stored in a source control repository, enabling versioning, history tracking, and collaboration https://learn.microsoft.com/en-us/training/modules/configure-provision-environments/2-provision-configure-target-environments .
- Continuous Delivery: IaC is a fundamental component of Continuous Delivery, ensuring that infrastructure changes are repeatable and traceable https://learn.microsoft.com/en-us/training/modules/configure-provision-environments/2-provision-configure-target-environments .
Best Practices for IaC
- Use of Azure Resource Manager Templates: Azure Resource Manager (ARM) templates allow for declarative specifications of Azure resources and can be used to manage infrastructure as code https://learn.microsoft.com/en-us/training/modules/security-monitoring-and-governance/2-implement-pipeline-security .
- Security: Protecting credentials and secrets is crucial. Use multifactor authentication (MFA) and tools like Azure PowerShell Just Enough Administration (JEA) to mitigate risks https://learn.microsoft.com/en-us/training/modules/security-monitoring-and-governance/2-implement-pipeline-security .
- CI/CD Release Pipeline: The release pipeline should be capable of rebuilding infrastructure if necessary. Manage IaC with tools like ARM or Azure DevOps, which can encrypt secrets in the pipeline https://learn.microsoft.com/en-us/training/modules/security-monitoring-and-governance/2-implement-pipeline-security .
- Permissions Management: Secure the pipeline with role-based access control (RBAC) to control who can edit build and release definitions https://learn.microsoft.com/en-us/training/modules/security-monitoring-and-governance/2-implement-pipeline-security .
- Dynamic Scanning and Monitoring: Implement security testing and monitoring practices, such as penetration testing and using services like Microsoft Defender for Cloud to detect security incidents https://learn.microsoft.com/en-us/training/modules/security-monitoring-and-governance/2-implement-pipeline-security .
Azure Services Supporting IaC
- Azure App Configuration: A service for central management of application settings and feature flags, which helps in managing distributed configuration settings https://learn.microsoft.com/en-us/training/modules/manage-application-configuration-data/5-introduction-to-azure-app-configuration .
- Azure Key Vault: Complements Azure App Configuration by storing application secrets and enhancing security https://learn.microsoft.com/en-us/training/modules/manage-application-configuration-data/5-introduction-to-azure-app-configuration .
Transitioning to PaaS and Serverless with IaC
- Platform as a Service (PaaS): When using PaaS, such as Azure Web Apps, the cloud provider manages the underlying infrastructure. Users only need to provide templates for the application deployment https://learn.microsoft.com/en-us/training/modules/configure-provision-environments/2-provision-configure-target-environments .
- Functions as a Service (FaaS): With serverless computing, like Azure Functions, the cloud provider takes care of the infrastructure. Users deploy the application code, and the cloud handles the rest https://learn.microsoft.com/en-us/training/modules/configure-provision-environments/2-provision-configure-target-environments .
Challenges with Local Configuration Files
- Downtime and Administrative Overhead: Changes to local configuration files often require redeployment, which can lead to downtime https://learn.microsoft.com/en-us/training/modules/manage-application-configuration-data/2-rethink-application-configuration-data .
- Configuration Drift: Managing changes across multiple instances can be challenging, leading to inconsistencies during updates https://learn.microsoft.com/en-us/training/modules/manage-application-configuration-data/2-rethink-application-configuration-data .
- Versioning: Many configuration systems do not support versioning, making it difficult to manage changes to configuration schemas https://learn.microsoft.com/en-us/training/modules/manage-application-configuration-data/2-rethink-application-configuration-data .
By adopting IaC and leveraging Azure services, organizations can streamline their configuration management strategy, reduce manual errors, and ensure that infrastructure deployment is consistent and repeatable. This approach aligns with modern DevOps practices and supports the efficient delivery of applications.
For additional information on Azure Resource Manager Templates and best practices, visit the following URLs: - Azure Resource Manager Templates: ARM Templates - Microsoft Defender for Cloud: Defender for Cloud - Open Web Application Security Project (OWASP): OWASP
Design and implement build and release pipelines (40–45%)
Design and implement infrastructure as code (IaC)
Define an IaC Strategy
Infrastructure as Code (IaC) is a key practice in DevOps that involves managing and provisioning computing infrastructure through machine-readable definition files, rather than physical hardware configuration or interactive configuration tools. An effective IaC strategy encompasses several components, including source control, automation of testing, and deployment.
Source Control
Source control is the practice of tracking and managing changes to code. In the context of IaC, it is essential to store the infrastructure definitions (such as scripts, templates, and configuration files) in a source control repository. This allows for versioning, history tracking, and collaboration among team members.
- Best Practices:
- Use a version control system like Git to manage IaC files.
- Implement branch policies to ensure code quality and compliance.
- Link commits to work items for better traceability of changes https://learn.microsoft.com/en-us/training/modules/introduction-to-secure-devops/5-explore-key-validation-points .
Automation of Testing
Automated testing is crucial for ensuring the reliability and security of the infrastructure as code. It involves the use of tools to automatically test and validate the code for potential errors and vulnerabilities before it is deployed.
- Best Practices:
- Integrate static code analysis tools in the Integrated Development Environment (IDE) to catch vulnerabilities early https://learn.microsoft.com/en-us/training/modules/introduction-to-secure-devops/5-explore-key-validation-points .
- Use Continuous Integration (CI) to automatically build and test the code after each commit.
- Enforce automated testing as part of the pull request process to prevent merging faulty code into the main branch https://learn.microsoft.com/en-us/training/modules/introduction-to-secure-devops/5-explore-key-validation-points .
Automation of Deployment
Deployment automation refers to the process of automatically deploying infrastructure changes to various environments. This is typically done through a Continuous Delivery (CD) pipeline.
- Best Practices:
- Define the release pipeline stages and triggers to automate the deployment process https://learn.microsoft.com/en-us/training/modules/explore-release-strategy-recommendations/3-exercise-select-your-delivery-deployment-cadence .
- Use Infrastructure as Code tools like Azure Resource Manager or third-party tools that integrate with Azure for provisioning and configuration https://learn.microsoft.com/en-us/training/modules/security-monitoring-and-governance/2-implement-pipeline-security .
- Implement Continuous Deployment triggers to initiate deployment after successful builds https://learn.microsoft.com/en-us/training/modules/explore-release-strategy-recommendations/3-exercise-select-your-delivery-deployment-cadence .
- Manage permissions with Role-Based Access Control (RBAC) to secure the pipeline https://learn.microsoft.com/en-us/training/modules/security-monitoring-and-governance/2-implement-pipeline-security .
Additional Resources
- For more information on Azure PowerShell and Just Enough Administration (JEA), visit Azure PowerShell JEA.
- Learn about the Open Web Application Security Project (OWASP) at OWASP.
- Explore Microsoft Defender for Cloud for security incident detection at Microsoft Defender for Cloud.
By integrating these practices into your IaC strategy, you can ensure that your infrastructure is reliable, secure, and efficiently managed.
Design and implement build and release pipelines (40–45%)
Design and implement infrastructure as code (IaC)
Design and Implement Desired State Configuration for Environments
Desired State Configuration (DSC) is a powerful feature that enables the deployment and management of configuration data for software services and the environment in which these services run. DSC provides a set of Windows PowerShell language extensions, cmdlets, and resources that you can use to declaratively specify how you want your software environment to be configured.
Azure Automation State Configuration
Azure Automation State Configuration is an Azure service that extends the capabilities of PowerShell DSC. It allows for the management and automation of configuration settings across virtual machines and nodes, ensuring they are consistent and compliant with the desired configuration state https://learn.microsoft.com/en-us/training/modules/implement-desired-state-configuration-dsc/4-explore-azure-automation .
Key features include: - Centralized Management: Write, manage, and compile DSC configurations in the cloud. - Import DSC Resources: Utilize custom or community DSC resources for your configurations. - Assign Configurations: Apply configurations to target nodes directly from Azure Automation.
For more information, visit: Azure Automation State Configuration
Azure Resource Manager and Bicep
Azure Resource Manager is the deployment and management service for Azure. It provides a management layer that enables you to create, update, and delete resources in your Azure account. You can use its features to deploy, manage, and monitor all the resources in your Azure environment as a group, known as a resource group.
Bicep is a domain-specific language (DSL) for deploying Azure resources declaratively. It uses a syntax that’s easy to understand and provides a transparent abstraction over Azure Resource Manager templates, which can be complex.
Key features include: - Declarative Syntax: Define the desired state of your Azure resources in a clear and concise manner. - Modularity: Create reusable components to organize your infrastructure code. - Integration: Seamlessly deploy Bicep files through Azure Resource Manager.
For more information, visit: Azure Bicep
Azure Automanage Machine Configuration
Azure Automanage Machine Configuration is a service that helps to automate the configuration and management of virtual machines. It applies best practices and standard configurations to virtual machines, ensuring they are well-managed, secure, and compliant.
Key features include: - Automated Best Practices: Apply Microsoft’s best practices for VM management automatically. - Simplified Compliance: Maintain compliance with organizational standards and service configurations. - Integrated Management: Use alongside other Azure services for a cohesive management experience.
For more information, visit: Azure Automanage
By leveraging these Azure services, you can design and implement a desired state configuration for your environments that is automated, consistent, and compliant with your organization’s standards.
Design and implement build and release pipelines (40–45%)
Design and implement infrastructure as code (IaC)
Design and Implement Azure Deployment Environments for On-Demand Self-Deployment
When designing and implementing Azure Deployment Environments for on-demand self-deployment, it is essential to consider the following aspects:
Self-Hosted Agents
Self-hosted agents in Azure Pipelines are agents that you set up and manage on your own infrastructure to run build and deployment jobs. These agents provide more control over the software and tools installed, which is necessary for specific builds and deployments. You can install self-hosted agents on various platforms, including Linux, macOS, Windows, and Linux Docker containers. One of the benefits of using a self-hosted agent is that there are no job time limits, allowing for more extended operations without interruption https://learn.microsoft.com/en-us/training/modules/manage-azure-pipeline-agents-pools/2-choose-between-microsoft-hosted-versus-self-hosted-agents .
Deployment Gates
Deployment gates are a critical feature in controlling the execution of Azure Pipelines. They allow you to specify criteria that must be met before a release is promoted to the next environment. For instance, you can configure a release pipeline with pre-deployment and post-deployment gates to ensure that no blocking bugs or active alerts are present before and after deploying to an environment. This phased approach to deployment helps monitor application health and user experience before wider exposure https://learn.microsoft.com/en-us/training/modules/explore-release-strategy-recommendations/8-control-deployments-using-release-gates .
Multiple Agents on the Same Machine
Running multiple agents on the same machine can be efficient for jobs that do not consume many shared resources. However, for builds that require significant disk and I/O resources, or when parallel jobs might interfere with each other (e.g., concurrent npm package updates), it may not be beneficial. It’s crucial to evaluate the types of jobs and resources used when considering multiple agents on a single machine https://learn.microsoft.com/en-us/training/modules/manage-azure-pipeline-agents-pools/9-examine-other-considerations .
Continuous Deployment Triggers
Continuous deployment triggers in Azure Pipelines enable automatic deployment of stages in a release pipeline when a build completes. You can configure these triggers to respond to specific branches, such as the main branch or feature branches, ensuring that only the desired updates trigger deployments https://learn.microsoft.com/en-us/training/modules/explore-release-strategy-recommendations/3-exercise-select-your-delivery-deployment-cadence .
Azure Blueprints
Azure Blueprints is a service that allows cloud architects to define a repeatable set of Azure resources that adhere to organizational standards and requirements. It enables rapid environment setup while maintaining compliance. Azure Blueprints orchestrate the deployment of various resource templates and artifacts, such as role assignments, policy assignments, ARM templates, and resource groups. Unlike ARM templates, Azure Blueprints maintain an active relationship with deployed resources, improving tracking and auditing https://learn.microsoft.com/en-us/training/modules/security-monitoring-and-governance/9-explore-azure-blueprints .
Additional Resources
For further information on setting up and managing self-hosted agents, you can refer to the following resources: - Self-hosted Windows agents - Run a self-hosted agent behind a web proxy
For a deeper understanding of deployment gates and how to configure them, the following resource may be helpful: - Configure deployment gates in Azure Pipelines
To learn more about continuous deployment triggers and how to set them up, you can visit: - Continuous deployment triggers in Azure Pipelines
For comprehensive guidance on implementing Azure Blueprints, the following resource is available: - Create and assign Azure Blueprints
By incorporating these elements into the design and implementation of Azure Deployment Environments, you can achieve efficient, compliant, and controlled on-demand self-deployment processes.
Design and implement build and release pipelines (40–45%)
Maintain pipelines
Monitoring pipeline health is a critical aspect of the DevOps process, which ensures that the software delivery pipeline is efficient, reliable, and produces quality output. When monitoring pipeline health, there are several key metrics to consider:
Failure Rate
The failure rate is a measure of the frequency at which the pipeline fails. This can be due to various reasons such as code defects, configuration errors, or environmental issues. A high failure rate can indicate problems in the development or deployment processes that need to be addressed. Monitoring the failure rate helps in identifying unstable builds or problematic areas in the pipeline that require attention.
Duration
The duration metric refers to the amount of time it takes for a pipeline to complete its execution. This includes the time taken for all stages of the pipeline, such as building, testing, and deploying. Monitoring the duration is important for identifying bottlenecks and improving the efficiency of the pipeline. A sudden increase in duration can also signal issues that may be slowing down the process, such as resource constraints or inefficient scripts.
Flaky Tests
Flaky tests are those that exhibit inconsistent results, passing at times and failing at others, without any changes to the code. These tests can be problematic as they can lead to false positives or negatives, affecting the reliability of the pipeline. Monitoring for flaky tests is essential to maintain the integrity of the testing process. Identifying and addressing the root causes of flakiness can help in achieving more stable and predictable outcomes.
To effectively monitor these metrics, teams can use various tools and practices:
Continuous Integration (CI) Tools: CI tools like Azure Pipelines provide built-in features to track and visualize pipeline health metrics. Teams can set up dashboards to monitor the status of builds and releases.
Alerting and Notifications: Configuring alerts for failed builds or tests can help teams respond quickly to issues. Notifications can be set up to inform relevant stakeholders about pipeline health.
Analytics and Reporting: Azure Pipelines and other CI/CD tools offer analytics and reporting features that allow teams to analyze historical data, identify trends, and make informed decisions to improve pipeline performance.
Test Stability Measures: Implementing retries for tests, quarantining flaky tests, and using test result analysis tools can help in managing flaky tests and improving test reliability.
For additional information on monitoring pipeline health and related best practices, you can refer to the following resources:
- Azure Pipelines documentation: Azure Pipelines
- Pipeline analytics in Azure Pipelines: Pipeline Analytics
- Monitoring application performance with Azure Monitor: Azure Monitor
By closely monitoring these metrics, teams can ensure that their pipelines are healthy, which is essential for delivering high-quality software in a timely and predictable manner.
Design and implement build and release pipelines (40–45%)
Maintain pipelines
Optimize Pipelines for Cost, Time, Performance, and Reliability
Optimizing pipelines is crucial for enhancing the efficiency and effectiveness of the development process. Here are several strategies to optimize pipelines:
Cost Optimization
- Utilize Efficient Build Tasks: Select appropriate build tasks to scan for license types and security vulnerabilities, which can help in identifying issues early and reducing the cost associated with late fixes https://learn.microsoft.com/en-us/training/modules/software-composition-analysis/7-examine-tools-for-assess-package-security-license-rate .
- Package Management: Use Azure Artifacts to organize and share packages efficiently, reducing the need to store binaries in Git and minimizing storage costs https://learn.microsoft.com/en-us/training/modules/software-composition-analysis/3-explore-software-composition-analysis .
Time Optimization
- Agent Communication: Configure the agent to communicate effectively with Azure Pipelines, ensuring that jobs are run promptly and logs are reported without delay. This pull model allows for different configurations that can save time https://learn.microsoft.com/en-us/training/modules/manage-azure-pipeline-agents-pools/7-communicate-with-azure-pipelines .
- Continuous Integration (CI) Pipeline: Implement a trusted feed for the CI pipeline using Azure Artifacts, which can speed up the build process by providing a local cache of approved components https://learn.microsoft.com/en-us/training/modules/software-composition-analysis/3-explore-software-composition-analysis .
Performance Optimization
- Parallel Jobs: Run multiple jobs in parallel to decrease the overall time taken for the pipeline to complete.
- Caching: Cache dependencies and intermediate build steps to avoid redundant operations in subsequent runs.
Reliability Optimization
- Secure Communication: Ensure that the payload of messages exchanged between the agent and Azure Pipelines is secured using asymmetric encryption, which enhances the reliability of the communication https://learn.microsoft.com/en-us/training/modules/manage-azure-pipeline-agents-pools/7-communicate-with-azure-pipelines .
- Secure DevOps Tools: Integrate specialist security products from the Visual Studio Code Marketplace into your Azure DevOps pipeline to address security issues reliably https://learn.microsoft.com/en-us/training/modules/software-composition-analysis/4-integrate-whitesource-azure-devops-pipeline .
Additional Strategies
- Personal Access Tokens (PATs): Generate and use a PAT to connect an agent with Azure Pipelines, which is secure and reliable for the registration process https://learn.microsoft.com/en-us/training/modules/manage-azure-pipeline-agents-pools/9-examine-other-considerations .
- Resource Management: Monitor and adjust the use of resources to prevent unnecessary expenses and overutilization.
For more information on Azure Artifacts and package management, you can visit What are Azure Artifacts? https://learn.microsoft.com/en-us/training/modules/software-composition-analysis/3-explore-software-composition-analysis .
By implementing these strategies, you can optimize your pipelines for cost, time, performance, and reliability, leading to a more streamlined and efficient development lifecycle.
Design and implement build and release pipelines (40–45%)
Maintain pipelines
Analyzing pipeline load to determine agent configuration and capacity is an essential aspect of optimizing Azure Pipelines for efficiency and performance. When considering agent configuration and capacity, it’s important to understand the differences between Microsoft-hosted and self-hosted agents, as well as the job types and agent pool configurations.
Microsoft-hosted vs. Self-hosted Agents: - Microsoft-hosted agents are provided by Azure Pipelines, with maintenance and upgrades handled automatically. Each time a pipeline runs, a fresh virtual machine instance is used, which is discarded after one use. This can be convenient, but there are job time limits and the start-up time for builds can vary depending on system load https://learn.microsoft.com/en-us/training/modules/manage-azure-pipeline-agents-pools/2-choose-between-microsoft-hosted-versus-self-hosted-agents . - Self-hosted agents are managed by the user and can run incremental builds, which can lead to faster build times since the repository does not need to be cleaned or rebuilt from scratch. However, they require more maintenance compared to Microsoft-hosted agents https://learn.microsoft.com/en-us/training/modules/manage-azure-pipeline-agents-pools/9-examine-other-considerations .
Agent Pool Configuration: - Agent pools are groups of agents with similar capabilities. Understanding typical situations for using agent pools and managing their security is crucial for efficient pipeline execution https://learn.microsoft.com/en-us/training/modules/manage-azure-pipeline-agents-pools/1-introduction . - The configuration of agent pools involves determining the number of agents required, the type of jobs they will handle, and the security settings for the pool.
Load Analysis: - To analyze pipeline load, consider the frequency of builds, the complexity of tasks, and the average build time. This will help in deciding whether to use Microsoft-hosted agents, which can be simpler but may have limitations, or self-hosted agents, which offer more control and potentially faster build times https://learn.microsoft.com/en-us/training/modules/manage-azure-pipeline-agents-pools/9-examine-other-considerations https://learn.microsoft.com/en-us/training/modules/manage-azure-pipeline-agents-pools/2-choose-between-microsoft-hosted-versus-self-hosted-agents . - For self-hosted agents, monitor the performance and queue times to determine if additional agents are needed to handle the load. This ensures that builds and deployments are not delayed due to insufficient agent capacity.
Capacity Planning: - Capacity planning involves ensuring that there are enough agents to handle peak loads without excessive queuing or delays. This may require scaling up the number of self-hosted agents or considering the use of multiple agent pools with specialized agents for different job types https://learn.microsoft.com/en-us/training/modules/manage-azure-pipeline-agents-pools/1-introduction .
Security Considerations: - When configuring agents and agent pools, it’s important to manage security appropriately. For self-hosted agents, ensure that the communication with Azure Pipelines is secure and that the agents are registered by an agent pool administrator https://learn.microsoft.com/en-us/training/modules/manage-azure-pipeline-agents-pools/7-communicate-with-azure-pipelines .
For additional information on managing Azure Pipeline agents and pools, you can refer to the following resources: - Manage Azure Pipeline Agents and Pools - Azure Pipelines Agents Documentation
By carefully analyzing pipeline load and considering the factors mentioned above, you can configure your agent pools to meet the demands of your build and deployment processes, ensuring efficient and reliable CI/CD pipelines.
Design and implement build and release pipelines (40–45%)
Maintain pipelines
Design and Implement a Retention Strategy for Pipeline Artifacts and Dependencies
When designing and implementing a retention strategy for pipeline artifacts and dependencies, it is essential to consider several key aspects to ensure that the strategy is effective and aligns with the organization’s needs. Here is a detailed explanation of the components involved in such a strategy:
Implementing a Versioning Strategy
A versioning strategy is crucial for managing different versions of
artifacts and dependencies. It allows teams to track changes, roll back
to previous versions if necessary, and understand the evolution of their
software components. Semantic versioning is a common approach that uses
a three-part number format, major.minor.patch, to signify
breaking changes, new features, and bug fixes, respectively. Best
practices for versioning include maintaining a clear changelog and
automating the versioning process as part of the CI/CD pipeline https://learn.microsoft.com/en-us/training/modules/implement-versioning-strategy/1-introduction
.
Promoting Packages
Package promotion involves moving artifacts through different stages of the development lifecycle, such as from development to testing and then to production. This ensures that only verified and tested artifacts are deployed in production environments. A promotion strategy should define the criteria for moving artifacts between stages and may include automated tests and manual approvals.
Pushing Packages from Pipeline
Automating the process of pushing packages from the CI/CD pipeline to artifact repositories is a key part of a retention strategy. This ensures that artifacts are stored reliably and are available for deployment or further development. The pipeline can be configured to push artifacts upon successful completion of predefined criteria, such as passing all tests https://learn.microsoft.com/en-us/training/modules/implement-versioning-strategy/1-introduction .
Setting Retention Policies
Retention policies define how long artifacts and dependencies are kept before being deleted or archived. These policies help manage storage costs and ensure compliance with data retention regulations. A default retention period can be set at the repository, organization, or enterprise level. Custom retention periods can also be set for specific uploads, but they must not exceed the established defaults https://learn.microsoft.com/en-us/training/modules/learn-continuous-integration-github-actions/4-share-artifacts-between-jobs .
Creating a Release Approval Plan
A release approval plan is part of the retention strategy that ensures artifacts are not prematurely or inadvertently released. It defines who has the authority to approve releases and under what conditions. This plan can include automated gates as well as manual checks to validate the quality and readiness of the artifacts for production https://learn.microsoft.com/en-us/training/modules/explore-release-strategy-recommendations/1-introduction .
Implementing Release Gates
Release gates are automated checks that occur at certain points in the release pipeline. They can include a variety of criteria, such as security scans, compliance checks, or performance benchmarks, that must be passed before an artifact can progress to the next stage. Release gates help ensure that only artifacts that meet all necessary requirements are retained for release https://learn.microsoft.com/en-us/training/modules/explore-release-strategy-recommendations/1-introduction https://learn.microsoft.com/en-us/training/modules/explore-release-strategy-recommendations/1-introduction .
Continuous Monitoring and Adjustment
Finally, it is important to continuously monitor the effectiveness of the retention strategy and make adjustments as needed. This may involve analyzing storage costs, reviewing the frequency of artifact access, and ensuring that the strategy aligns with evolving business requirements and compliance standards.
For additional information on designing and implementing a retention strategy for pipeline artifacts and dependencies, you can refer to the following resources:
By following these guidelines, you can create a robust retention strategy that ensures the integrity and availability of your pipeline artifacts and dependencies while optimizing storage and maintaining compliance.
Develop a security and compliance plan (10–15%)
Design and implement a strategy for managing sensitive information in automation
Implement and Manage Service Connections
Service connections are a critical component in the automation of deployment pipelines, especially when these pipelines need access to external resources. To implement and manage service connections effectively, it is essential to understand their purpose and how they are created and used within the context of deployment pipelines.
Purpose of Service Connections
Service connections provide a secure way for Azure DevOps pipelines to access external resources that are required during the build or deployment process. These resources can be within Azure, such as Azure SQL Database, or external services like GitHub repositories or Docker registries.
Creating Service Connections
To create a service connection:
- Navigate to the project settings in Azure DevOps.
- Select ‘Service connections’ under the ‘Pipelines’ category.
- Click on ‘New service connection’ and choose the type of service you need to connect to.
- Fill in the required details, such as subscription information, service principal details, or certificates, depending on the type of connection.
- Grant the necessary permissions and save the service connection for use in your pipelines.
Managing Service Connections
Once a service connection is created, it can be used across multiple pipelines within the same project. It is important to manage these connections by:
- Regularly reviewing and updating the credentials.
- Monitoring the usage of service connections to ensure they are being used securely and appropriately.
- Auditing access and permissions to make sure only authorized users and pipelines can use the service connections.
Best Practices for Service Connections
- Use Service Principals: When authenticating to Azure with service connections, it is recommended to use service principals rather than user credentials or personal access tokens https://learn.microsoft.com/en-us/training/modules/configure-provision-environments/9-knowledge-check .
- Infrastructure as Code: In continuous delivery, managing infrastructure as code is essential, and service connections can be used to deploy infrastructure components as part of the release pipeline https://learn.microsoft.com/en-us/training/modules/configure-provision-environments/2-provision-configure-target-environments .
- Environment Provisioning: Understanding the target environment is crucial for provisioning and setting up service connections. This includes knowing whether you are deploying to on-premises servers, cloud servers (IaaS), PaaS, FaaS, or clusters https://learn.microsoft.com/en-us/training/modules/configure-provision-environments/2-provision-configure-target-environments .
Additional Resources
For more information on service connections, you can refer to the following resources:
By following these guidelines and utilizing the resources provided, you can effectively implement and manage service connections to streamline your deployment processes and maintain a secure and efficient CI/CD pipeline.
Develop a security and compliance plan (10–15%)
Design and implement a strategy for managing sensitive information in automation
Implement and Manage Personal Access Tokens
Personal Access Tokens (PATs) are a secure way to authenticate to Azure services without using passwords. They are used to access Azure DevOps services and other Azure resources that support PATs as an authentication mechanism. Here’s a detailed explanation of how to implement and manage PATs:
Implementation of Personal Access Tokens:
- Creation: To create a PAT, you need to sign in to your Azure DevOps organization. Under your profile, select ‘Security’ and then ‘Personal access tokens’. Click on ‘New Token’ to create a new PAT.
- Scope: When creating a PAT, you can define its scope to restrict access to specific Azure DevOps services. It’s essential to adhere to the principle of least privilege, granting only the necessary permissions to perform the required tasks.
- Expiration: Set an expiration date for the PAT to enhance security. It’s recommended to choose the shortest duration necessary for your use case to minimize the risk of token misuse.
- Usage: Once created, the PAT can be used in place of a password when performing Git operations over HTTPS or when using the Azure DevOps REST API.
Management of Personal Access Tokens:
- Regeneration: If a PAT is compromised or nearing expiration, you can regenerate it. This action will invalidate the old token and issue a new one with the same permissions.
- Revocation: You can revoke a PAT at any time if it’s no longer needed or if you suspect it has been compromised. Revoking a PAT immediately prevents it from being used for authentication.
- Audit: Regularly review your PATs to ensure they are still necessary and have appropriate permissions. Remove any PATs that are no longer needed.
Best Practices:
- Secure Storage: Treat PATs as you would treat a password. Store them securely and never share them.
- Regular Rotation: Regularly rotate your PATs to reduce the risk of them being compromised.
- Monitoring: Monitor the usage of PATs to detect any unauthorized access or anomalies in their usage patterns.
For additional information on implementing and managing Personal Access Tokens, you can refer to the following resources: - Authenticate with Personal Access Tokens - Create a Personal Access Token
By following these guidelines, you can ensure that Personal Access Tokens are used securely and effectively within your Azure environment.
Develop a security and compliance plan (10–15%)
Design and implement a strategy for managing sensitive information in automation
Implement and Manage Secrets, Keys, and Certificates
Azure Key Vault
Azure Key Vault is a cloud service that provides a secure store for secrets, keys, and certificates. It allows organizations to:
- Centralize Storage of Application Secrets: Connection strings, passwords, and certificates can be stored securely in Azure Key Vault https://learn.microsoft.com/en-us/training/modules/manage-application-configuration-data/8-integrate-azure-key-vault-azure-pipelines .
- Hardware Security Modules (HSMs): Secrets and keys are protected by HSMs, ensuring high levels of security https://learn.microsoft.com/en-us/training/modules/manage-application-configuration-data/8-integrate-azure-key-vault-azure-pipelines https://learn.microsoft.com/en-us/training/modules/manage-application-configuration-data/9-manage-secrets-tokens-certificates .
- Versioning and Traceability: Azure Key Vault provides versioning of secrets and full traceability of their use https://learn.microsoft.com/en-us/training/modules/manage-application-configuration-data/8-integrate-azure-key-vault-azure-pipelines .
- Access Policies: Efficient permission management is possible through access policies, which control who can access the stored secrets https://learn.microsoft.com/en-us/training/modules/manage-application-configuration-data/8-integrate-azure-key-vault-azure-pipelines .
- Integration with Azure Pipelines: Azure Key Vault can be integrated with Azure Pipelines to manage secrets during the deployment process https://learn.microsoft.com/en-us/training/modules/manage-application-configuration-data/1-introduction .
For more information on Azure Key Vault, you can visit the official documentation: What is Azure Key Vault.
GitHub Secrets
GitHub Secrets is a feature that allows you to store sensitive information related to your GitHub Actions workflows:
- Secure Storage: Secrets are encrypted and can be used within GitHub Actions workflows to handle sensitive data like passwords or keys https://learn.microsoft.com/en-us/training/modules/learn-continuous-integration-github-actions/8-create-encrypted-secrets .
- Limited Access: Only GitHub Actions workflows can access these secrets, and they are not exposed to the public or logged in the build logs https://learn.microsoft.com/en-us/training/modules/learn-continuous-integration-github-actions/8-create-encrypted-secrets .
Azure Pipelines Secrets
Azure Pipelines also provides a mechanism to handle secrets within the CI/CD process:
- Secure and Hidden: Secrets in Azure Pipelines are encrypted and hidden from the build logs to prevent accidental exposure https://learn.microsoft.com/en-us/training/modules/learn-continuous-integration-github-actions/8-create-encrypted-secrets .
- Variable Groups: Secrets can be organized into variable groups for different environments or stages in the pipeline.
Best Practices for Managing Secrets
- Separation of Concerns: Keep secrets separate from your application code and configuration files https://learn.microsoft.com/en-us/training/modules/manage-application-configuration-data/1-introduction .
- Least Privilege Access: Grant access to secrets only to the services and individuals that absolutely need them.
- Regular Rotation: Regularly rotate secrets to reduce the risk of them being compromised.
- Audit and Monitor: Continuously audit access to secrets and monitor their usage to detect any unauthorized access.
By implementing and managing secrets, keys, and certificates using Azure Key Vault, GitHub secrets, and Azure Pipelines secrets, organizations can enhance the security of their applications and protect sensitive information from unauthorized access.
Develop a security and compliance plan (10–15%)
Design and implement a strategy for managing sensitive information in automation
Design and Implement a Strategy for Managing Sensitive Files During Deployment
When deploying applications, managing sensitive files and information is crucial to maintain security and prevent unauthorized access. Here are some strategies to effectively manage sensitive files during deployment:
1. Use .gitignore for Source Control Exclusions
Ensure that sensitive files, such as configuration files containing
secrets or private keys, are not accidentally committed to source
control. Utilize a .gitignore file to specify the files and
directories that should be excluded from commits https://learn.microsoft.com/en-us/training/modules/manage-application-configuration-data/2-rethink-application-configuration-data
.
2. Abstract Configuration Management
Abstract the management of configuration settings from the developers to prevent sensitive information from being exposed. This can be done by using environment variables or secure configuration stores that are not part of the codebase https://learn.microsoft.com/en-us/training/modules/manage-application-configuration-data/2-rethink-application-configuration-data .
3. Implement DevSecOps Practices
Incorporate security into the DevOps process, making it a shared responsibility among all team members. This involves evaluating security at every step of the process, from design to deployment, and ensuring continuous security validation and monitoring https://learn.microsoft.com/en-us/training/modules/introduction-to-secure-devops/1-introduction .
4. Secure Application Configurations
Avoid storing sensitive information such as passwords or connection
strings in application configuration files like app.config
or web.config. Instead, use secure and centralized
configuration management systems that can dynamically inject these
settings during the deployment process https://learn.microsoft.com/en-us/training/modules/manage-application-configuration-data/2-rethink-application-configuration-data
.
5. Utilize Deployment Gates
Configure deployment gates in your release pipelines to control the execution of deployments based on certain health criteria or approval processes. This can prevent the deployment of updates that may compromise the security of the application https://learn.microsoft.com/en-us/training/modules/explore-release-strategy-recommendations/8-control-deployments-using-release-gates .
6. Employ Environment Variables and Secrets in CI/CD Pipelines
Use environment variables and encrypted secrets to manage sensitive information within continuous integration and deployment pipelines. Services like GitHub Actions allow you to securely store and access these secrets during the build and deployment process https://learn.microsoft.com/en-us/training/modules/learn-continuous-integration-github-actions/1-introduction .
7. Best Practices for Sensitive Files
- Never hard-code sensitive information in your source code.
- Regularly rotate secrets and credentials.
- Use secret management tools and services provided by cloud providers.
- Implement access controls and audit logs to monitor access to sensitive information.
For additional information on managing sensitive files and implementing secure deployment strategies, you can refer to the following resources: - Introduction to Secure DevOps - Continuous Integration Using GitHub Actions
By following these strategies and best practices, you can design and implement a robust approach to managing sensitive files during the deployment of applications, ensuring that security is maintained throughout the application lifecycle.
Develop a security and compliance plan (10–15%)
Design and implement a strategy for managing sensitive information in automation
Designing Pipelines to Prevent Leakage of Sensitive Information
When designing pipelines, it is crucial to implement measures that prevent the leakage of sensitive information. Here are some strategies to ensure that sensitive data is protected throughout the DevOps process:
Package Management and Approval Processes: Integrate package management solutions that include approval processes for software packages before they are used in the pipeline. This step should be enacted early in the pipeline to identify and address potential security issues as soon as possible https://learn.microsoft.com/en-us/training/modules/introduction-to-secure-devops/4-explore-secure-devops-pipeline .
Source Scanning: Implement source scanning tools in the pipeline to check for vulnerabilities in the application code. This scanning should occur after the application is built but before release and pre-release testing, allowing for the early identification of security vulnerabilities https://learn.microsoft.com/en-us/training/modules/introduction-to-secure-devops/4-explore-secure-devops-pipeline .
Secure DevOps Extensions: Utilize extensions from marketplaces such as the Visual Studio Code Marketplace to integrate specialist security products into your Azure DevOps pipeline. These extensions can provide seamless integration and enhance the security of your pipeline https://learn.microsoft.com/en-us/training/modules/software-composition-analysis/4-integrate-whitesource-azure-devops-pipeline .
DevSecOps Practices: Incorporate security into every step of the DevOps process by adopting DevSecOps practices. This approach makes security the responsibility of everyone on the team and shifts security from being an afterthought to being evaluated at every process step https://learn.microsoft.com/en-us/training/modules/introduction-to-secure-devops/1-introduction .
Continuous Security Validation: Add continuous security validation at each step from development through production. This ensures that the application remains secure throughout its lifecycle. The goal is to have the security team consent to the CI/CD process itself, rather than approving each release, and to monitor and audit the process at any time https://learn.microsoft.com/en-us/training/modules/introduction-to-secure-devops/5-explore-key-validation-points .
Security Extensions for Open Source: Use extensions like Mend, available on the Azure DevOps Marketplace, to address security-related issues, especially for open-source components. Mend specifically addresses open-source security, quality, and license compliance concerns, which is critical since many breaches target known vulnerabilities in standard components https://learn.microsoft.com/en-us/training/modules/software-composition-analysis/4-integrate-whitesource-azure-devops-pipeline .
By implementing these strategies, you can design a pipeline that minimizes the risk of sensitive information leakage and enhances the overall security posture of your DevOps process.
For additional information on Secure DevOps and DevSecOps practices, you can refer to the following resources: - Introduction to Secure DevOps - Visual Studio Code Marketplace - Azure DevOps Marketplace - Mend Extension for Azure DevOps
Please note that the URLs provided are for reference and further reading on the topics discussed.
Develop a security and compliance plan (10–15%)
Automate security and compliance scanning
Automating Source Code Analysis with GitHub Advanced Security
GitHub Advanced Security offers a suite of tools designed to enhance the security of your codebase. It includes features such as code scanning, secret scanning, and dependency scanning, which can be automated to ensure continuous security assessment throughout the development lifecycle. These tools are also compatible with Azure DevOps, allowing for a seamless integration into existing workflows.
Code Scanning
Code scanning is an automated process that reviews every
git push to detect security vulnerabilities within your
code. It utilizes the power of CodeQL, which is GitHub’s
industry-leading semantic code analysis engine, to perform the scans.
Code scanning can identify a range of potential issues, from SQL
injection to cross-site scripting, and it provides actionable feedback
directly within pull requests.
- Integration with Azure DevOps: While GitHub Advanced Security is native to GitHub, Azure DevOps users can integrate GitHub code scanning by using the GitHub Actions or the GitHub App in their Azure Pipelines.
Secret Scanning
Secret scanning protects your repositories by scanning for known types of secrets, like passwords, API keys, and tokens that might have been accidentally committed. When a secret is detected, GitHub alerts you so you can take immediate action to secure your repository and prevent potential breaches.
- Integration with Azure DevOps: Azure DevOps users can leverage secret scanning by ensuring that their code repositories in Azure Repos are synchronized with a GitHub repository where secret scanning is enabled.
Dependency Scanning
Dependency scanning helps you manage the open-source components you use in your software. It scans your dependencies for known vulnerabilities and provides you with a detailed report, including the severity of the vulnerability and how to remediate it.
- Integration with Azure DevOps: Dependency scanning can be integrated into Azure DevOps through the use of GitHub Actions or by utilizing tools like Dependabot, which can also be configured to submit pull requests to update vulnerable dependencies automatically.
Additional Resources
For more information on setting up and using GitHub Advanced Security features, you can visit the following URLs:
- GitHub Advanced Security documentation: GitHub Advanced Security
- CodeQL documentation for code scanning: CodeQL
- GitHub secret scanning: Secret Scanning
- Dependabot for dependency scanning: Dependabot
By automating the analysis of source code with these tools, you can significantly reduce the risk of security vulnerabilities in your software, ensuring a more secure development process. Integrating these scans into your CI/CD pipeline allows for early detection and resolution of potential issues, maintaining the integrity and security of your codebase.
Develop a security and compliance plan (10–15%)
Automate security and compliance scanning
Automating Pipeline-Based Scans with SonarQube
In the realm of DevOps, ensuring the security and quality of code is paramount. Automation of pipeline-based scans is a critical practice that integrates security checks within the Continuous Integration/Continuous Deployment (CI/CD) pipeline. One of the tools that stand out in this area is SonarQube, a static code analysis tool designed to detect bugs, vulnerabilities, and code smells in your source code.
SonarQube Integration into CI/CD Pipelines
SonarQube can be seamlessly integrated into CI/CD pipelines to automate code quality checks. Here’s how it can be done:
Install and Configure SonarQube: First, you need to set up a SonarQube server which can be self-hosted or used as a service. Once the server is ready, create a project in SonarQube to which the analysis will be posted.
Integrate with Build Tools: SonarQube supports various build tools like Maven, Gradle, MSBuild, etc. You need to configure your build tool to include the SonarQube analysis step. This typically involves adding a plugin or extension to your build configuration.
Update Pipeline Configuration: Modify your pipeline configuration to include a SonarQube analysis task. This task will trigger the static code analysis during the build process. For Azure Pipelines, you can use the SonarQube extension available in the Visual Studio Marketplace.
Execute Analysis: When the pipeline runs, the SonarQube analysis will be executed as part of the build process. The code will be analyzed against predefined rulesets for quality and security.
Review Results: After the analysis is complete, the results will be sent to the SonarQube server. Developers can review the detailed report on the SonarQube dashboard, which includes information on code quality, security vulnerabilities, and technical debt.
Quality Gates: SonarQube provides Quality Gates, which are a set of conditions that the project must meet before it can be considered as passed. If the code does not meet these conditions, the pipeline can be configured to fail, preventing the promotion of bad code.
Automate Fixing: Some issues detected by SonarQube can be automatically fixed. Developers can configure rules and actions that can be applied to automatically address certain types of issues.
Additional Resources
- For more information on integrating SonarQube with Azure Pipelines, visit the Visual Studio Marketplace.
- To understand how to set up and configure SonarQube, refer to the official SonarQube documentation.
By automating the use of SonarQube in your CI/CD pipelines, you ensure that every change to the codebase is automatically scanned for potential issues, thereby maintaining high standards of code quality and security throughout the development lifecycle https://learn.microsoft.com/en-us/training/modules/software-composition-analysis/7-examine-tools-for-assess-package-security-license-rate https://learn.microsoft.com/en-us/training/modules/introduction-to-secure-devops/6-explore-continuous-security-validation .
Develop a security and compliance plan (10–15%)
Automate security and compliance scanning
Automate Security Scanning
Automated security scanning is a critical component of Secure DevOps practices. It involves integrating security checks into the development pipeline to identify and address vulnerabilities early and continuously throughout the software development lifecycle.
Container Scanning
Container scanning is an automated process that examines container images for security vulnerabilities. When enabled, tools like Microsoft Defender for Containers (formerly Azure Defender for container registries) scan images when they are pushed to a registry, imported, or pulled within the last 30 days https://learn.microsoft.com/en-us/training/modules/security-monitoring-and-governance/10-understand-microsoft-defender-identity . This scanning helps to ensure that containers are free from known vulnerabilities before they are deployed. Although Microsoft Defender for container registries is deprecated, it is still functional for subscriptions where it was previously enabled. For new features and improvements, upgrading to Microsoft Defender for Containers is recommended https://learn.microsoft.com/en-us/training/modules/security-monitoring-and-governance/10-understand-microsoft-defender-identity .
OWASP Zed Attack Proxy (ZAP)
The OWASP Zed Attack Proxy (ZAP) is an open-source security tool designed for finding vulnerabilities in web applications. It is one of the world’s most popular free security tools and is actively maintained by hundreds of international volunteers. ZAP can help you automatically find security vulnerabilities in your web applications while you are developing and testing your applications. It’s also a tool that can be used for manual security testing by professional penetration testers.
Integration into DevOps
Integrating these security scanning tools into a DevOps pipeline allows for continuous and automated security checks. This integration can be achieved by incorporating scanning tasks into the Continuous Integration/Continuous Deployment (CI/CD) release pipeline https://learn.microsoft.com/en-us/training/modules/security-monitoring-and-governance/2-implement-pipeline-security . For instance, dynamic scanning can be part of the release process, where the running application is tested against known attack patterns https://learn.microsoft.com/en-us/training/modules/security-monitoring-and-governance/2-implement-pipeline-security . Tools like OWASP ZAP can be integrated into the pipeline to perform automated security assessments on web applications as part of the release process.
Best Practices
- Authentication and Authorization: Implement multifactor authentication (MFA) and use tools like Azure PowerShell Just Enough Administration (JEA) to protect against privilege escalations https://learn.microsoft.com/en-us/training/modules/security-monitoring-and-governance/2-implement-pipeline-security .
- CI/CD Release Pipeline: Use Infrastructure as Code (IaC) to manage and rebuild infrastructure, and encrypt secrets within the pipeline using services like Azure DevOps https://learn.microsoft.com/en-us/training/modules/security-monitoring-and-governance/2-implement-pipeline-security .
- Permissions Management: Secure the pipeline with role-based access control (RBAC) to maintain control over build and release definitions https://learn.microsoft.com/en-us/training/modules/security-monitoring-and-governance/2-implement-pipeline-security .
- Dynamic Scanning: Test the running application with known attack patterns and implement penetration testing as part of the release process https://learn.microsoft.com/en-us/training/modules/security-monitoring-and-governance/2-implement-pipeline-security .
- Production Monitoring: Use specialized services like Microsoft Defender for Cloud to detect security incidents related to the Azure cloud https://learn.microsoft.com/en-us/training/modules/security-monitoring-and-governance/2-implement-pipeline-security .
For more information on container scanning and security practices, refer to the following resources: - Microsoft Defender for Containers: Microsoft Defender for Cloud - OWASP Zed Attack Proxy (ZAP): OWASP ZAP
By automating security scanning within the DevOps pipeline, teams can ensure that security is a continuous and integral part of the software development process, thereby reducing the risk of deploying software with vulnerabilities.
Develop a security and compliance plan (10–15%)
Automate security and compliance scanning
Automating Analysis of Open-Source Components with Mend Bolt and GitHub Dependency Scanning
When managing open-source components in a software development project, it is crucial to ensure that the components are secure, compliant with licensing, and up-to-date. Automation of these analyses can significantly streamline the process and reduce the risk of introducing vulnerabilities or licensing issues into your codebase. Two tools that facilitate this automation are Mend Bolt and GitHub Dependency Scanning.
Mend Bolt
Mend Bolt, formerly known as WhiteSource, is a tool that integrates with Azure DevOps to automatically detect vulnerable open-source components, outdated libraries, and license compliance issues. It is designed to work seamlessly within your build process, regardless of the programming languages, build tools, or development environments you use https://learn.microsoft.com/en-us/training/modules/software-composition-analysis/9-implement-security-compliance-azure-pipeline .
Key features of Mend Bolt include:
- Vulnerability Detection: Mend Bolt scans your open-source components against a continuously updated database to identify security vulnerabilities https://learn.microsoft.com/en-us/training/modules/software-composition-analysis/9-implement-security-compliance-azure-pipeline .
- License Compliance: It enforces open-source license compliance by checking the licenses of dependencies and ensuring they align with your project’s requirements https://learn.microsoft.com/en-us/training/modules/software-composition-analysis/9-implement-security-compliance-azure-pipeline .
- Outdated Library Identification: The tool identifies outdated open-source libraries and provides recommendations for updates https://learn.microsoft.com/en-us/training/modules/software-composition-analysis/9-implement-security-compliance-azure-pipeline .
- Integration with Azure DevOps: Mend Bolt can be integrated into your Azure DevOps pipeline, enabling you to detect and remedy issues as part of your CI/CD process https://learn.microsoft.com/en-us/training/modules/software-composition-analysis/9-implement-security-compliance-azure-pipeline .
Mend Bolt operates on a per-project basis and is recommended for larger development teams that aim to automate open-source management throughout the software development lifecycle https://learn.microsoft.com/en-us/training/modules/software-composition-analysis/9-implement-security-compliance-azure-pipeline .
GitHub Dependency Scanning
GitHub Dependency Scanning is a feature that helps you identify vulnerable dependencies in your repositories. When GitHub detects a new vulnerability in the GitHub Advisory Database, it sends Dependabot alerts to inform you about the vulnerable dependencies https://learn.microsoft.com/en-us/training/modules/software-composition-analysis/10-knowledge-check .
The key aspects of GitHub Dependency Scanning include:
- Automated Alerts: Receive alerts when a new vulnerability is added to the GitHub Advisory Database that affects your repository https://learn.microsoft.com/en-us/training/modules/software-composition-analysis/10-knowledge-check .
- Continuous Monitoring: GitHub continuously monitors your dependencies for new vulnerabilities and sends alerts if any are found.
- Integration with GitHub Workflows: Dependency Scanning is integrated into GitHub workflows, allowing for seamless scanning during code commits and other GitHub actions.
By using Mend Bolt in conjunction with GitHub Dependency Scanning, you can create a robust system for managing the security and compliance of open-source components in your projects. Mend Bolt provides a comprehensive solution for Azure DevOps environments, while GitHub Dependency Scanning offers real-time alerts and monitoring within the GitHub ecosystem.
For additional information on Mend Bolt and how to activate it, you can refer to the Mend official website https://learn.microsoft.com/en-us/training/modules/software-composition-analysis/9-implement-security-compliance-azure-pipeline . To learn more about GitHub Dependency Scanning and how to set it up for your repositories, visit the GitHub documentation on Dependency Scanning.
By automating the analysis of licensing, vulnerabilities, and versioning of open-source components with these tools, you can maintain a high standard of security and compliance in your software development projects.
Develop a security and compliance plan (10–15%)
Automate security and compliance scanning
Integrate GitHub Advanced Security with Microsoft Defender for Cloud
Integrating GitHub Advanced Security with Microsoft Defender for Cloud enhances the security posture of your development and deployment environments by providing advanced threat detection, security recommendations, and incident response capabilities. Here’s a detailed explanation of how to achieve this integration:
Enable Microsoft Defender for Cloud: To start, ensure that Microsoft Defender for Cloud is enabled for your Azure subscription. Microsoft Defender for Cloud offers two versions: Free and Standard. The Standard version provides a full suite of security-related services, including continuous monitoring and threat detection https://learn.microsoft.com/en-us/training/modules/security-monitoring-and-governance/3-explore-microsoft-defender-cloud .
Configure Security Policies: Define and configure security policies in Microsoft Defender for Cloud according to your organization’s security requirements. These policies will help identify potential security vulnerabilities and provide recommendations for enhancing security https://learn.microsoft.com/en-us/training/modules/security-monitoring-and-governance/4-examine-microsoft-defender-cloud-usage-scenarios .
Install Microsoft Defender Sensors: For on-premises environments, install Microsoft Defender sensors on your domain controllers. These sensors monitor traffic and send data to the Microsoft Defender cloud service for analysis https://learn.microsoft.com/en-us/training/modules/security-monitoring-and-governance/10-understand-microsoft-defender-identity .
Access Microsoft Defender Portal: Use the Microsoft Defender portal to manage your Microsoft Defender instance. The portal allows you to monitor, manage, and investigate threats to your network environment https://learn.microsoft.com/en-us/training/modules/security-monitoring-and-governance/10-understand-microsoft-defender-identity .
Integrate GitHub Advanced Security: GitHub Advanced Security provides additional security features such as code scanning, secret scanning, and dependency review. To integrate these features with Microsoft Defender for Cloud, you will need to set up the appropriate GitHub actions and workflows that align with the security policies and controls defined in Microsoft Defender for Cloud.
Monitor and Respond: With the integration in place, monitor the security alerts and recommendations provided by Microsoft Defender for Cloud. Use the Microsoft Defender portal to respond to suspicious activity detected by both Microsoft Defender and GitHub Advanced Security https://learn.microsoft.com/en-us/training/modules/security-monitoring-and-governance/10-understand-microsoft-defender-identity .
Continuous Improvement: Regularly review the security recommendations and alerts to continuously improve your security posture. Implement the recommended security controls and remediation steps described by Microsoft Defender for Cloud https://learn.microsoft.com/en-us/training/modules/security-monitoring-and-governance/4-examine-microsoft-defender-cloud-usage-scenarios .
For additional information and guidance on setting up and using Microsoft Defender for Cloud, you can refer to the following resources: - Microsoft Defender for Cloud: Microsoft Defender for Cloud - Microsoft Defender for Cloud planning and operations guide: Microsoft Defender for Cloud planning and operations guide - Microsoft Defender portal: Microsoft Defender portal
By following these steps, you can effectively integrate GitHub Advanced Security with Microsoft Defender for Cloud to create a robust security framework that protects your development and deployment pipelines from advanced threats and vulnerabilities.
Implement an instrumentation strategy (10–15%)
Configure monitoring for a DevOps environment
Configure and Integrate Monitoring Using Azure Monitor
Azure Monitor is a comprehensive solution for collecting, analyzing, and acting on telemetry from your cloud and on-premises environments. It helps you understand how your applications are performing and proactively identifies issues affecting them and the resources they depend on.
Key Features of Azure Monitor:
Data Collection: Azure Monitor can collect data from a variety of sources, including application telemetry, Azure resource metrics, subscription-level events, and logs.
Analysis Tools: It provides powerful analysis tools that can help you diagnose issues and understand what’s happening in your environment. You can create custom dashboards, set up alerts, and perform complex queries to gain insights from your data.
Integration with Azure Services: Azure Monitor integrates with other Azure services like Azure Security Center and Azure Automation, allowing for a centralized monitoring approach.
Alerting and Notification: You can configure alerts based on metrics or logs to notify you of critical conditions and potentially take automated actions to resolve issues.
Visualizations: Azure Monitor provides various visualization tools, including dashboards, views, and workbooks, to help you quickly understand the data and discover patterns.
Steps to Configure and Integrate Monitoring:
Enable Monitoring for Azure Resources: Use Azure Monitor to enable monitoring for Azure resources such as VMs, databases, and containers. This will automatically collect performance metrics and diagnostic logs.
Set Up Alerts: Define alert rules in Azure Monitor to notify you when certain conditions are met, such as CPU usage exceeding a threshold or an error rate spiking.
Create Dashboards: Build custom dashboards in Azure Monitor to visualize metrics and logs. This can help you quickly assess the health of your resources and applications.
Log Analytics: Utilize Log Analytics for querying and analyzing log data collected from your Azure resources. You can write queries to troubleshoot issues, identify trends, or create custom monitoring scenarios.
Application Insights: For application performance monitoring, integrate Application Insights with Azure Monitor. This will help you track your application’s performance and diagnose issues with your web applications.
Azure Automation: Combine Azure Monitor with Azure Automation to create runbooks that automatically take actions in response to alerts, such as scaling resources or restarting services.
Security Monitoring: Integrate Azure Monitor with Microsoft Defender for Cloud to monitor security settings and automatically apply required security to new services as they come online https://learn.microsoft.com/en-us/training/modules/security-monitoring-and-governance/3-explore-microsoft-defender-cloud .
Key Vault Monitoring: If using Azure Key Vault, enable logging to monitor access to keys and secrets. Configure Azure Key Vault to archive logs to a storage account, stream to Event Hubs, or send logs to Log Analytics https://learn.microsoft.com/en-us/training/modules/manage-application-configuration-data/9-manage-secrets-tokens-certificates .
Additional Resources:
- For more information on Azure Monitor and its capabilities, visit the Azure Monitor documentation.
- To set up dependency tracking and understand the performance of external services, refer to Azure Monitor Application Insights.
- Learn about setting up availability tests and monitoring web app availability through Azure Application Insights.
- For details on configuring Azure Key Vault monitoring, review the Azure Key Vault documentation.
By following these steps and utilizing the resources provided, you can effectively configure and integrate monitoring for your Azure environment using Azure Monitor. This will help ensure that you have a comprehensive view of your applications and infrastructure, allowing you to maintain performance and availability.
Implement an instrumentation strategy (10–15%)
Configure monitoring for a DevOps environment
Configure and Integrate with Monitoring Tools
Monitoring tools are essential for maintaining the health, availability, and performance of applications and services. Azure provides several monitoring tools that can be configured and integrated to provide comprehensive monitoring solutions. Below are details on how to configure and integrate with Azure Monitor, Application Insights, and the Prometheus managed service.
Azure Monitor
Azure Monitor is a comprehensive solution for collecting, analyzing, and acting on telemetry from your cloud and on-premises environments. It helps you understand how your applications are performing and proactively identifies issues affecting them and the resources they depend on.
Configuration Steps:
- Access Azure Monitor: Navigate to the Azure portal and select Azure Monitor from the services list.
- Set Up Metrics: In the Azure Monitor dashboard, you can set up metrics to track the performance of your resources.
- Create Alerts: Configure alerts to notify you when certain conditions are met, such as CPU usage thresholds.
- Log Analytics: Set up a Log Analytics workspace to collect and analyze data from different sources.
- Application Insights Integration: Connect Application Insights for deeper application telemetry.
Integration Points:
- Resource Logs: Integrate with services that emit logs to collect data about the operation of those services.
- Application Insights: Combine with Application Insights for an in-depth view of application performance.
- Automation: Use Azure Automation to respond to alerts with automated actions.
For more information on Azure Monitor, visit Azure Monitor Documentation.
Application Insights
Application Insights is an extensible Application Performance Management (APM) service for developers and DevOps professionals. It monitors the live applications, automatically detecting performance anomalies, and includes powerful analytics tools to help you diagnose issues and understand what users do with your app.
Configuration Steps:
- Create an Application Insights Resource: In the Azure portal, create a new Application Insights resource.
- Instrument Your Application: Add the Application Insights SDK to your application to start collecting telemetry.
- Configure Telemetry Modules: Customize which data is collected by configuring telemetry modules as needed.
- Set Up Availability Tests: Create availability tests to monitor the availability of your web applications.
Integration Points:
- Azure Monitor: Application Insights data can be accessed within Azure Monitor for a unified monitoring experience.
- Continuous Export: Set up continuous export of telemetry to Azure Storage or Azure Event Hubs for further analysis.
- Workbooks: Use Workbooks to create interactive data visualizations based on telemetry data.
For more information on Application Insights, visit Application Insights Documentation.
Prometheus Managed Service
Prometheus is an open-source monitoring system with a dimensional data model, flexible query language, efficient time series database, and modern alerting approach. Azure provides a managed Prometheus service that can be used to monitor Kubernetes environments.
Configuration Steps:
- Set Up Prometheus: Deploy Prometheus in your Kubernetes cluster or use the Azure Managed Prometheus service.
- Configure Targets: Define the targets and service endpoints that Prometheus should monitor.
- Define Alert Rules: Create alerting rules to define conditions for sending alerts.
- Grafana Integration: Integrate with Grafana for advanced data visualization.
Integration Points:
- Azure Monitor: Integrate Prometheus metrics with Azure Monitor for a centralized view of metrics across your infrastructure.
- Azure Kubernetes Service (AKS): Use Prometheus to monitor Kubernetes clusters managed by AKS.
For more information on Prometheus on Azure, visit Azure Monitor for containers.
By configuring and integrating these monitoring tools, you can gain a comprehensive view of your applications and infrastructure, allowing you to maintain high availability and performance.
Implement an instrumentation strategy (10–15%)
Configure monitoring for a DevOps environment
Manage Access Control to the Monitoring Platform
Access control is a critical aspect of securing a monitoring platform. It involves defining who can access the platform, what resources they can access, and the actions they can perform. Here are the key practices for managing access control to a monitoring platform, such as Microsoft Defender for Cloud:
Multi-Factor Authentication (MFA)
Implementing MFA adds an additional layer of security by requiring two or more verification methods. This could include something the user knows (password), something the user has (security token), or something the user is (biometrics) https://learn.microsoft.com/en-us/training/modules/security-monitoring-and-governance/2-implement-pipeline-security .
Role-Based Access Control (RBAC)
RBAC allows you to manage who has access to what within your organization. By assigning roles to users, groups, and services, you can control access to resources in the monitoring platform. This ensures that only authorized personnel can edit build and release definitions that are used for production https://learn.microsoft.com/en-us/training/modules/security-monitoring-and-governance/2-implement-pipeline-security .
Just-In-Time (JIT) Access
JIT access control reduces the attack surface by enabling network traffic only when required. This practice is particularly useful for ports, as it ensures that they are open only when needed and for a limited time, thus minimizing the window of opportunity for an attack https://learn.microsoft.com/en-us/training/modules/security-monitoring-and-governance/3-explore-microsoft-defender-cloud .
Continuous Monitoring and Security Assessments
The monitoring platform should continuously monitor services and perform automatic security assessments to identify potential vulnerabilities. This proactive approach helps in detecting issues before they can be exploited https://learn.microsoft.com/en-us/training/modules/security-monitoring-and-governance/3-explore-microsoft-defender-cloud .
Azure Policies
Azure Policies enforce organizational standards and assess compliance at scale. Through its policy definitions, you can ensure that resources in your monitoring platform comply with your company’s requirements https://learn.microsoft.com/en-us/training/modules/security-monitoring-and-governance/1-introduction .
Microsoft Defender for Cloud
Microsoft Defender for Cloud is a tool that provides advanced threat protection for your services in Azure and on-premises. It offers security recommendations, continuous monitoring, and automatic application of security to new services as they come online. To access the full suite of services, you may need to upgrade to the Standard version https://learn.microsoft.com/en-us/training/modules/security-monitoring-and-governance/3-explore-microsoft-defender-cloud https://learn.microsoft.com/en-us/training/modules/security-monitoring-and-governance/3-explore-microsoft-defender-cloud .
For more detailed information on managing access control to the monitoring platform, you can refer to the following resources: - Just Enough Administration (JEA) - Microsoft Defender for Cloud - Center for Internet Security (CIS) Benchmarks
By following these practices, you can ensure that your monitoring platform is secure and that only authorized users have access to sensitive data and capabilities.
Implement an instrumentation strategy (10–15%)
Configure monitoring for a DevOps environment
Configuring alerts for pipeline events is an essential aspect of monitoring and managing the continuous integration and continuous delivery (CI/CD) process in Azure DevOps. Alerts help team members stay informed about the status of their pipelines and take immediate action if necessary. Here’s a detailed explanation of how to configure alerts for pipeline events:
Step 1: Access Azure DevOps
First, sign in to your Azure DevOps organization and navigate to the project where you want to set up alerts.
Step 2: Open Notifications
Go to the project settings and find the “Notifications” section. This is where you can manage and create alerts for various events within your project.
Step 3: Create a New Subscription
Click on “New subscription” to start setting up an alert. You will be prompted to choose the type of event you want to be notified about.
Step 4: Select Pipeline Events
From the list of event categories, select “Builds” or “Releases” depending on which pipeline events you want to configure alerts for. These categories include events such as pipeline completion, failures, and more.
Step 5: Define Alert Criteria
Specify the criteria for the alert. You can choose to be alerted for all pipelines or specific ones. Additionally, you can filter by event types, such as a failed build or a successful release.
Step 6: Set Notification Preferences
Decide how you want to receive notifications. Azure DevOps supports email alerts, and you can specify the recipients who need to be notified. You can also configure alerts to be sent to teams or individuals.
Step 7: Save the Subscription
Once you have configured the alert to your satisfaction, save the subscription. The system will now send notifications according to your settings whenever the specified pipeline events occur.
Additional Information
For more detailed instructions and best practices on setting up alerts in Azure DevOps, you can refer to the official documentation provided by Microsoft:
- Create a service hook for Azure DevOps
- Manage notifications for a team or group
- Notifications and subscriptions in Azure DevOps
By following these steps and utilizing the resources provided, you can effectively configure alerts for pipeline events in Azure DevOps, ensuring that your team is always up-to-date with the CI/CD process.
Implement an instrumentation strategy (10–15%)
Analyze metrics
Inspect Distributed Tracing by Using Application Insights
Distributed tracing is a method for monitoring applications, especially those that are built using a microservices architecture. It helps in understanding the behavior and performance of the application by tracking the flow of requests across various services and components. Application Insights, a feature of Azure Monitor, provides powerful tools for implementing distributed tracing.
Key Concepts of Distributed Tracing with Application Insights:
Automatic Telemetry Collection: Application Insights automatically collects telemetry from your web applications with minimal configuration. This includes performance metrics, exception tracking, and request tracing https://learn.microsoft.com/en-us/training/modules/manage-alerts-blameless-retrospectives-just-culture/2-examine-when-get-notification .
Smart Detection Notifications: Application Insights has a feature called Smart Detection, which automatically warns you about potential performance problems and anomalies in your application. This is particularly useful for identifying issues that might affect the distributed tracing process https://learn.microsoft.com/en-us/training/modules/manage-alerts-blameless-retrospectives-just-culture/2-examine-when-get-notification .
Diagnostic Information: When Smart Detection identifies an issue, it sends notifications that include diagnostic information. This information can help you triage the problem by showing how many users or operations are affected, the scope of the problem (such as whether it’s affecting all traffic or just some pages), and suggestions for diagnosing the issue https://learn.microsoft.com/en-us/training/modules/manage-alerts-blameless-retrospectives-just-culture/3-explore-how-to-fix-it .
Performance Blade and Profiler: To further diagnose issues identified by distributed tracing, you can use the Performance blade in Application Insights. This tool provides Profiler data, which can give insights into the performance of your application’s code https://learn.microsoft.com/en-us/training/modules/manage-alerts-blameless-retrospectives-just-culture/3-explore-how-to-fix-it .
Snapshot Debugger: For exceptions that are thrown during the execution of your application, the Snapshot Debugger can be used. It takes snapshots of the application’s state at the time of exceptions, which can be invaluable for debugging complex distributed systems https://learn.microsoft.com/en-us/training/modules/manage-alerts-blameless-retrospectives-just-culture/3-explore-how-to-fix-it .
Implementing Distributed Tracing:
Configure Your Application: To start using Application Insights for distributed tracing, you need to configure your application. This involves setting up Application Insights for your application stack, which could be ASP.NET, Java, Node.js, or web page code https://learn.microsoft.com/en-us/training/modules/manage-alerts-blameless-retrospectives-just-culture/2-examine-when-get-notification .
Enable Smart Detection: Ensure that Smart Detection notifications are enabled. These notifications are sent by default to owners, contributors, and readers with access to the Application Insights resource. You can configure these settings as needed https://learn.microsoft.com/en-us/training/modules/manage-alerts-blameless-retrospectives-just-culture/4-explore-smart-detection-notifications .
Monitor Notifications: Keep an eye on the Smart Detection email notifications for performance anomalies. These emails are limited to one per day per Application Insights resource and are only sent if a new issue is detected https://learn.microsoft.com/en-us/training/modules/manage-alerts-blameless-retrospectives-just-culture/4-explore-smart-detection-notifications .
Analyze Diagnostic Data: Use the diagnostic information provided in the notifications to understand the impact and scope of any identified issues. This can help prioritize and address problems affecting your application’s distributed tracing https://learn.microsoft.com/en-us/training/modules/manage-alerts-blameless-retrospectives-just-culture/3-explore-how-to-fix-it .
Utilize Profiler and Snapshot Debugger: For in-depth analysis, leverage the Profiler and Snapshot Debugger tools provided by Application Insights. These tools can help you understand the performance bottlenecks and exceptions in your application https://learn.microsoft.com/en-us/training/modules/manage-alerts-blameless-retrospectives-just-culture/3-explore-how-to-fix-it .
For additional information on setting up and using Application Insights for distributed tracing, you can refer to the following resources:
- Smart Detection and Notifications: Smart Detection in Application Insights
- Application Insights Overview: Application Insights Overview
- Profiler: Application Insights Profiler
- Snapshot Debugger: Application Insights Snapshot Debugger
By following these steps and utilizing the tools provided by Application Insights, you can effectively implement and inspect distributed tracing to monitor and improve the performance and reliability of your applications.
Implement an instrumentation strategy (10–15%)
Analyze metrics
Inspect Application Performance Indicators
When inspecting application performance indicators, it is essential to understand various metrics and tools that can help identify and diagnose performance issues. Here are some key points to consider:
Blameless Retrospectives and Just Culture
Creating a just culture and conducting blameless retrospectives are critical for improving application performance. This approach focuses on learning from incidents without assigning blame, allowing teams to identify the root causes of issues and prevent them from recurring https://learn.microsoft.com/en-us/training/modules/manage-alerts-blameless-retrospectives-just-culture/1-introduction https://learn.microsoft.com/en-us/training/modules/manage-alerts-blameless-retrospectives-just-culture/1-introduction .
Reducing Non-Actionable Alerts
It is important to reduce meaningless and non-actionable alerts. This helps in focusing on significant issues that require attention, thereby improving the efficiency of the monitoring process https://learn.microsoft.com/en-us/training/modules/manage-alerts-blameless-retrospectives-just-culture/1-introduction https://learn.microsoft.com/en-us/training/modules/manage-alerts-blameless-retrospectives-just-culture/1-introduction .
Server Response-Time Degradation
Server response-time degradation is a common performance issue where the application starts responding to requests more slowly than usual. This could be due to a regression in the latest deployment or a gradual issue like a memory leak https://learn.microsoft.com/en-us/training/modules/manage-alerts-blameless-retrospectives-just-culture/2-examine-when-get-notification .
Dependency Duration Degradation
Applications often rely on external services or databases, known as dependencies. If these dependencies respond more slowly than before, it can degrade the overall application performance https://learn.microsoft.com/en-us/training/modules/manage-alerts-blameless-retrospectives-just-culture/2-examine-when-get-notification .
Slow Performance Patterns
Performance issues may affect only some requests or operations. For example, certain types of browsers may experience slower page loads, or requests served from a particular server may be slower. Identifying these patterns is crucial for targeted troubleshooting https://learn.microsoft.com/en-us/training/modules/manage-alerts-blameless-retrospectives-just-culture/2-examine-when-get-notification .
Smart Detection
Smart Detection is a feature that requires at least eight days of telemetry data to establish a normal performance baseline. Once established, it can notify you of significant performance issues https://learn.microsoft.com/en-us/training/modules/manage-alerts-blameless-retrospectives-just-culture/2-examine-when-get-notification .
Tools for Diagnosing Performance Issues
- Application Insights: A feature-rich tool that provides comprehensive monitoring of your application’s performance and usage. It can detect issues like response time degradation and slow performance patterns https://learn.microsoft.com/en-us/training/modules/manage-alerts-blameless-retrospectives-just-culture/2-examine-when-get-notification .
- Browsers Metric Blade: This tool helps determine where the performance bottleneck is occurring, whether it’s the server response time, page size, or client-side processing https://learn.microsoft.com/en-us/training/modules/manage-alerts-blameless-retrospectives-just-culture/5-improve-performance .
- Performance Metrics: Investigate response times by looking at performance metrics provided by tools like Application Insights https://learn.microsoft.com/en-us/training/modules/manage-alerts-blameless-retrospectives-just-culture/5-improve-performance .
- Dependency Tracking: Set up dependency tracking to determine if the slowness is due to external services or databases https://learn.microsoft.com/en-us/training/modules/manage-alerts-blameless-retrospectives-just-culture/5-improve-performance .
- Availability Tests: Configure availability tests to check the load times of different files and ensure that all dependent parts of the page are loading correctly https://learn.microsoft.com/en-us/training/modules/manage-alerts-blameless-retrospectives-just-culture/5-improve-performance .
For additional information on these topics, you can refer to the following resources: - Performance metrics - Dependency tracking - Availability tests
By understanding and utilizing these indicators and tools, you can effectively inspect and improve your application’s performance.
Implement an instrumentation strategy (10–15%)
Analyze metrics
Inspecting infrastructure performance indicators is a critical aspect of maintaining the health and efficiency of your IT environment. These indicators include CPU, memory, disk, and network usage, which can all impact the performance of your applications and services. Here’s a detailed explanation of each:
CPU Usage
CPU usage is a measure of how much processing power your system is using. High CPU usage can indicate that your application is performing a lot of computations or that it is inefficiently using resources. Monitoring CPU usage helps in identifying processes that are consuming excessive CPU time and may require optimization.
Memory Usage
Memory usage refers to the amount of RAM that is being used by the system. If your application is using too much memory, it may lead to swapping, where parts of the memory are written to disk, slowing down the system. Monitoring memory usage is essential to ensure that your application has enough memory to operate efficiently and to prevent out-of-memory errors.
Disk Usage
Disk usage involves monitoring the storage consumption and the read/write operations on the disk. Slow disk access can be a bottleneck for applications that rely heavily on disk operations. It is important to monitor disk space to avoid running out of storage, which can cause system failures, and to monitor disk I/O to ensure that the disk performance is not degrading over time.
Network Usage
Network usage is the measure of the data being transferred over your network. Monitoring network usage is important to ensure that your network has sufficient bandwidth to handle the traffic without causing delays. High network usage could indicate a need for network optimization or an upgrade to handle increased traffic.
For additional information on monitoring these performance indicators, you can refer to the following resources:
Azure Monitor: Azure Monitor provides comprehensive solutions for collecting, analyzing, and acting on telemetry from your cloud and on-premises environments. It helps you understand how your applications are performing and proactively identifies issues affecting them and the resources they depend on.
Application Insights: Application Insights, a feature of Azure Monitor, is an extensible Application Performance Management (APM) service for developers and DevOps professionals. It monitors the performance and usage of your live applications and automatically detects performance anomalies.
Microsoft Defender for Cloud: Microsoft Defender for Cloud offers security recommendations and monitoring for your resources. It can help you assess the security posture of your infrastructure and take action to mitigate potential vulnerabilities.
By regularly inspecting these performance indicators, you can ensure that your infrastructure is running optimally, identify potential issues before they become critical, and maintain a high level of service quality for your users.
Implement an instrumentation strategy (10–15%)
Analyze metrics
Identify and Monitor Metrics for Business Value
When identifying and monitoring metrics for business value, it is essential to focus on performance indicators that align closely with the organization’s strategic goals and objectives. These metrics should provide insights into the efficiency, effectiveness, and impact of various processes and systems within the business.
Performance Metrics and Response Times: To ensure that your services are performing optimally, it is crucial to monitor performance metrics. For instance, if you observe that the Send Request Time is high, this could indicate that the server is responding slowly or that the request contains a significant amount of data. To investigate response times further, you can utilize performance metrics tools provided by Azure Monitor https://learn.microsoft.com/en-us/training/modules/manage-alerts-blameless-retrospectives-just-culture/5-improve-performance .
Dependency Tracking: Dependency tracking is another vital aspect of monitoring business value. It helps determine whether any slowness in the system is due to external services or your database. By setting up dependency tracking, you can gain insights into how external dependencies affect your application’s performance https://learn.microsoft.com/en-us/training/modules/manage-alerts-blameless-retrospectives-just-culture/5-improve-performance .
Availability Tests: Conducting availability tests is a proactive way to ensure that your web applications are accessible and performing as expected. These tests can include loading dependent parts such as JavaScript, CSS, and images to measure load times and identify potential bottlenecks. Detailed results from these tests can reveal the load times of different files, which is valuable for understanding the user experience https://learn.microsoft.com/en-us/training/modules/manage-alerts-blameless-retrospectives-just-culture/5-improve-performance .
Client Processing Time: High client processing time can suggest that scripts on the client side are running slowly. If the cause is not immediately apparent, adding timing code and tracking metrics can help pinpoint the issue. This allows for targeted optimization to improve the end-user experience https://learn.microsoft.com/en-us/training/modules/manage-alerts-blameless-retrospectives-just-culture/5-improve-performance .
App Configuration and Environment Labels: In the context of application configuration, labels can be used to differentiate key values with the same key, which is particularly useful for managing configurations across multiple environments such as Test, Staging, and Production. This approach enables you to monitor and adjust configurations specific to each environment, ensuring that the application delivers business value consistently across all stages of deployment https://learn.microsoft.com/en-us/training/modules/manage-application-configuration-data/6-examine-key-value-pairs .
Azure App Configuration: Azure App Configuration is a service that stores configuration data as key-value pairs. It is essential to monitor these configurations to ensure that they align with business objectives and that any changes to configurations do not negatively impact business value https://learn.microsoft.com/en-us/training/modules/manage-application-configuration-data/6-examine-key-value-pairs .
Security and Compliance: Microsoft Defender for Cloud is a comprehensive monitoring service that provides threat protection and security recommendations. By continuously monitoring services and performing automatic security assessments, it helps identify potential vulnerabilities. This contributes to the business value by protecting against threats that could disrupt services or lead to data breaches https://learn.microsoft.com/en-us/training/modules/security-monitoring-and-governance/3-explore-microsoft-defender-cloud .
Just-In-Time Access Control: Reducing the attack surface through just-in-time access control for ports ensures that the network only allows necessary traffic. This security measure is crucial for maintaining the integrity and availability of services, which directly impacts business value https://learn.microsoft.com/en-us/training/modules/security-monitoring-and-governance/3-explore-microsoft-defender-cloud .
For additional information on these topics, you can refer to the following resources: - Azure Monitor Application Insights - Dependency Tracking in Azure Application Insights - Availability Testing in Azure Application Insights - Microsoft Defender for Cloud - Center for Internet Security (CIS) Benchmarks
By carefully selecting and monitoring these metrics, organizations can ensure that their IT infrastructure and applications are not only supporting but also enhancing their business value.
Implement an instrumentation strategy (10–15%)
Analyze metrics
Analyze Usage Metrics by Using Application Insights
Application Insights is a feature of Azure Monitor that provides comprehensive monitoring capabilities for web applications. It automatically collects and analyzes performance metrics and telemetry data to help you understand how your application is performing and how it’s being used by your end-users. Here’s how you can analyze usage metrics using Application Insights:
Performance Monitoring: Application Insights allows you to monitor the performance of your web application. It can automatically detect performance anomalies and includes powerful analytics tools to help you understand the data collected from your application https://learn.microsoft.com/en-us/training/modules/manage-alerts-blameless-retrospectives-just-culture/2-examine-when-get-notification .
Smart Detection: This feature provides proactive notifications about potential performance issues. Smart detection notifications are enabled by default and are sent to the owners, contributors, and readers with access to the Application Insights resource. These notifications include diagnostic information that can help you triage, scope, and diagnose issues https://learn.microsoft.com/en-us/training/modules/manage-alerts-blameless-retrospectives-just-culture/4-explore-smart-detection-notifications .
Browser Metrics: The Browser Metrics blade in Application Insights provides a segmented display of browser page load time, helping you identify where the time is being spent. For example, if the Send Request Time is high, it could indicate that the server is responding slowly. Dependency tracking can be set up to determine if the slowness is due to external services or your database. High Client Processing time might suggest that scripts are running slowly on the client side https://learn.microsoft.com/en-us/training/modules/manage-alerts-blameless-retrospectives-just-culture/5-improve-performance .
Diagnostic Information: Notifications from Application Insights include diagnostic information that can help you understand the impact of the issue, such as the number of users or operations affected. This information can help you prioritize issues and determine if they are widespread or isolated to specific pages, browsers, or locations https://learn.microsoft.com/en-us/training/modules/manage-alerts-blameless-retrospectives-just-culture/3-explore-how-to-fix-it .
Smart Alerts: Smart Alerts are part of the Smart Detection feature and can notify you about issues such as server response time degradation. These alerts can provide insights into how many users are affected and the correlation between degradation in operations and related dependencies https://learn.microsoft.com/en-us/training/modules/manage-alerts-blameless-retrospectives-just-culture/10-knowledge-check .
Additional Tools: Application Insights integrates with other Azure services such as Profiler and Snapshot Debugger to provide in-depth analysis and troubleshooting capabilities. Profiler data can help you understand performance bottlenecks, while the Snapshot Debugger can assist in diagnosing exceptions thrown by your application https://learn.microsoft.com/en-us/training/modules/manage-alerts-blameless-retrospectives-just-culture/3-explore-how-to-fix-it .
For more detailed information and to set up Application Insights for your application, you can refer to the following resources: - Application Insights Overview - Set up Application Insights for ASP.NET - Set up Application Insights for Java - Set up Application Insights for Node.js - Set up Application Insights for web page monitoring
By leveraging these tools and resources, you can effectively analyze usage metrics and gain valuable insights into the performance and usage of your web application.
Implement an instrumentation strategy (10–15%)
Analyze metrics
Interrogating Logs with Basic Kusto Query Language (KQL) Queries
Kusto Query Language (KQL) is a powerful tool used to query large datasets in Azure, particularly for logs and telemetry data. Understanding the basics of KQL is essential for efficiently interrogating and analyzing logs within Azure services.
Basic Structure of a KQL Query
A KQL query typically consists of a data source, a set of filter expressions, and a selection of fields to output. Here’s a simple example:
TableName
| where TimeGenerated > ago(1d)
| where SeverityLevel == "Error"
| project TimeGenerated, Message
In this example: - TableName is the data source, such as
a log table. - where clauses filter the data based on the
time generated and severity level. - project specifies the
output to display only the time generated and the message of the
log.
Common KQL Operators
where: Filters the data based on a condition.project: Selects which columns to display in the final output.summarize: Aggregates data based on specified grouping.join: Combines rows from two or more tables based on a related column.top: Returns the first N records sorted by a specified column.
Example Queries
Filtering by Time Range and Severity:
LogsTable
| where TimeGenerated between (startofday(ago(7d)) .. endofday(now()))
| where Severity == "Warning"
| project TimeGenerated, Message, Severity
Aggregating Data:
LogsTable
| summarize Count = count() by Severity
| order by Count desc
Finding Unique Values:
LogsTable
| summarize by UniqueUsers = distinct(UserName)
Joining Tables:
LogsTable
| join kind=inner (
    UserTable
    | where UserType == "Admin"
  ) on UserName
| project TimeGenerated, LogsTable.Message, UserTable.Department
Learning Resources
To further enhance your understanding of KQL, you can refer to the following resources:
KQL Overview: A comprehensive guide to the Kusto Query Language, its syntax, and its capabilities. KQL Overview
KQL Quick Reference: A quick reference sheet for KQL syntax, operators, and functions. KQL Quick Reference
Write KQL Queries: A tutorial on writing basic KQL queries for log analysis. Write KQL Queries
By familiarizing yourself with KQL, you can effectively interrogate and analyze logs in Azure, which is a critical skill for managing and maintaining Azure services.
Implement an instrumentation strategy (10–15%)
Analyze metrics
Interrogating Logs with Basic Kusto Query Language (KQL) Queries
Kusto Query Language (KQL) is a powerful tool used to query large datasets, particularly logs and telemetry data, in Azure services such as Azure Monitor, Application Insights, and Log Analytics. Understanding the basics of KQL is essential for efficiently interrogating and analyzing logs to gain insights into the performance and health of applications and services.
Basic Structure of a KQL Query
A KQL query typically consists of a data source, a set of filter expressions, and a selection of fields to output. Here’s a simple example of a KQL query structure:
T | where TimeGenerated > ago(1d) | project TimeGenerated, EventLevelName, MessageIn this example: - T is the table or data source
containing the logs. - where is a filter operator that
selects records from the past day
(TimeGenerated > ago(1d)). - project is
used to specify the columns to be displayed in the results
(TimeGenerated, EventLevelName,
Message).
Common KQL Operators
where: Filters the data based on the specified criteria.project: Selects which columns to return in the query results.summarize: Aggregates data based on the specified grouping.join: Combines rows from two or more tables based on a related column.top: Returns the first N records sorted by a specified column.
Example KQL Queries
Filtering Logs by Time Range and Severity:
Logs | where TimeGenerated >= ago(7d) and Severity == "Error" | project TimeGenerated, Severity, MessageThis query retrieves all logs with a severity level of “Error” from the last 7 days, projecting the time generated, severity, and message.
Aggregating Error Counts by Type:
Logs | where Severity == "Error" | summarize Count = count() by ErrorType | order by Count descThis query counts the number of errors grouped by the
ErrorTypefield and orders the results by the count in descending order.Finding Top 10 Most Frequent Errors:
Logs | where Severity == "Error" | summarize Count = count() by Message | top 10 by CountThis query identifies the top 10 most frequent error messages in the logs.
Learning Resources
To further enhance your understanding of KQL, you can explore the following resources:
KQL Documentation: The official KQL documentation provides a comprehensive guide to the language syntax, operators, and functions. KQL Documentation
KQL Tutorial: A step-by-step tutorial that introduces the basics of KQL and how to write effective queries. KQL Tutorial
KQL Query Samples: A collection of sample queries that can be used as a starting point for building your own queries. KQL Query Samples
By mastering the basics of KQL, you can efficiently analyze log data to troubleshoot issues, monitor system performance, and make data-driven decisions.